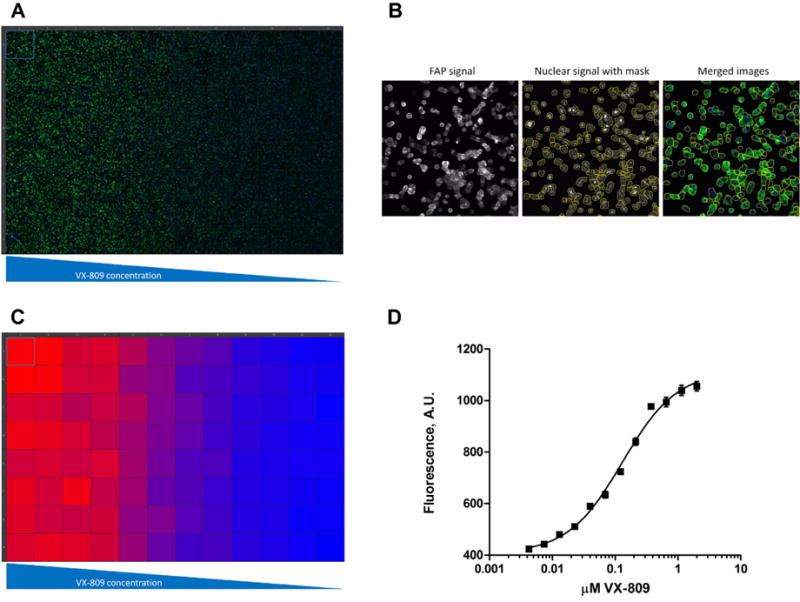
Fig. 2.

Dose–response curve for VX-809 correction of F508del CFTR surface expression. (A) Raw image data from a 96-well plate where increasing concentrations of VX-809 were added for 24 h to 293A cells stably transfected with FAP-F508del CFTR and imaged after Hoechst 33342 and MG-B-TAU addition. Hoechst 33342 signal is in blue and MG-B-TAU signal in green. (B) Here is shown an example of an image from one of the wells with the thickened nuclear binary mask that is used to define the region-of-interest in which MG-B-TAU signal is measured. (C) Heat map for MG-B-TAU signal of the raw data shown in (A). (D) Fitted dose–response curve for VX-809 activation of F508del CFTR surface expression. The VX-809 EC50 value was calculated to be 0.13 μM. Shown is average signal plus/minus SEM. The experiment was repeated 3 times with similar results.
