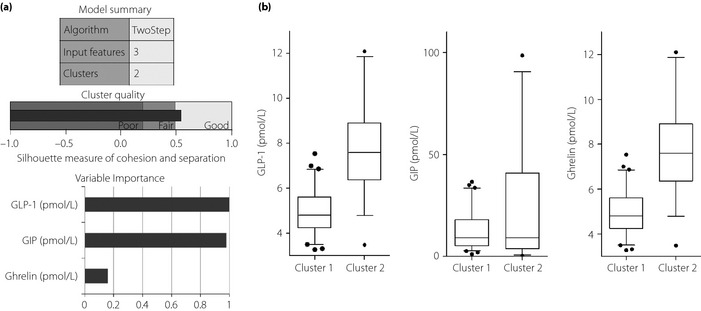
Figure 1.

(a) Model summary of the two‐step cluster analysis with a graph of the quality of clusters and importance of the three input variables. (b) Differences in serum levels of glucagon‐like peptide‐1 (GLP‐1), glucose‐dependent insulinotropic polypeptide (GIP) and ghrelin between cluster 1 and cluster 2; the ends of the whiskers represent the 5th and 95th percentiles.
