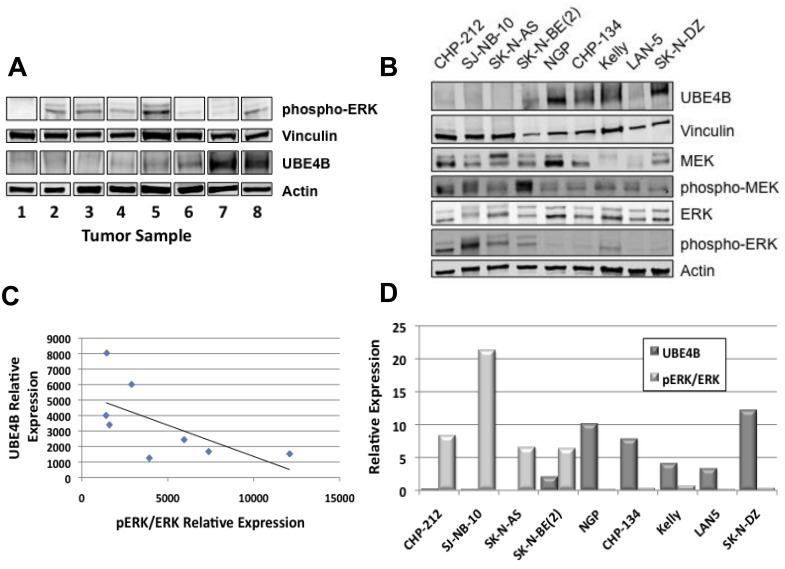
Figure 7. UBE4B, MEK, and ERK Expression in Neuroblastoma Tumor Cell Lines and Tissue Samples.
(A.) Neuroblastoma patient samples were lysed and Western blots for UBE4B and phosphorylated ERK were performed. Vinculin and actin were used as loading controls. (B.) A panel of neuroblastoma cell lines were lysed and Western blots for UBE4B and for total and phosphorylated MEK and ERK were performed. Vinculin and actin was used as loading controls. Densitometry analysis was performed to quantify relative phospho-ERK and UBE4B protein levels in neuroblastoma tumor samples (C.) and cell lines (D.) Spearman's correlation analysis was performed with UBE4B and pERK protein levels as shown. R = −0.7381 and p = 0.03655 for tumor samples (C.) and R = −0.78333 and p = 0.01252 for cell lines (D.).

