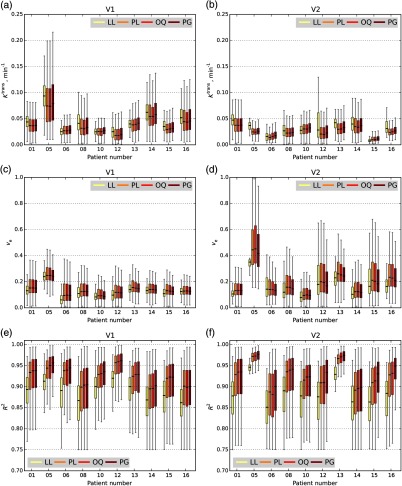
Fig. 11.
Boxplots of , , and of 10 BCa patients calculated by different BAT methods. The boxplots, including (a,b) , (c,d) , and (e,f) measured on two different visits; ROIs using four automatic BAT estimation methods. ROIs corresponds to the visit 1 (a,c,e) and visit 2 (b,d,f). Four different automatic BAT estimation methods (LL, PL, OQ, and PG) are compared in modeling the tissue with TM. Only voxels satisfying Eq. (8) with are included.

