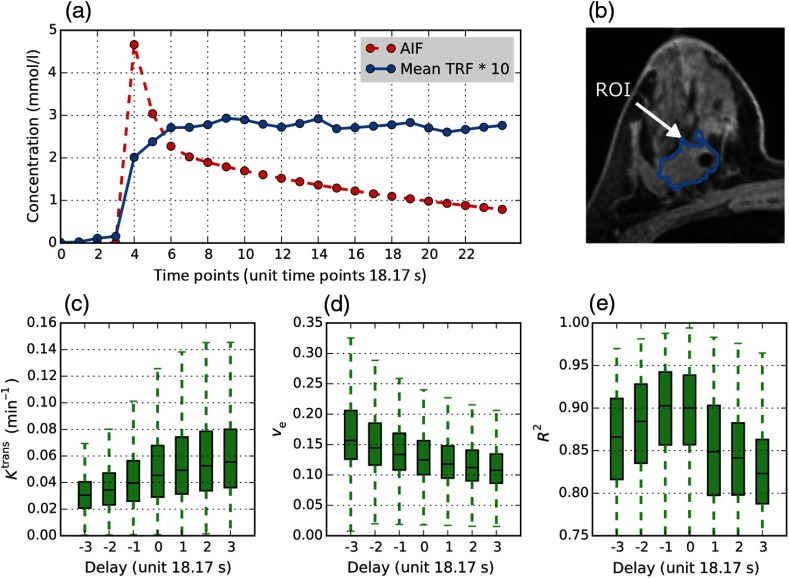
Fig. 6.
Sensitivity of BCa DCE-MRI PK analysis to delay between AIF and TRF: patient #16, visit1. was provided as population averaged: (a) Illustration of concentration curves for population averaged AIF (red dotted line), the mean (blue solid line) for 5147 TRF curves in the TROI. (b) 2-D axial image showing delineated tissue ROI on DCE-MRI image. (c–e) boxplots of (c) , (d) , and (e) at different BATTRF timepoints with the same BATAIF (timepoint unit: DCE-MRI ).

