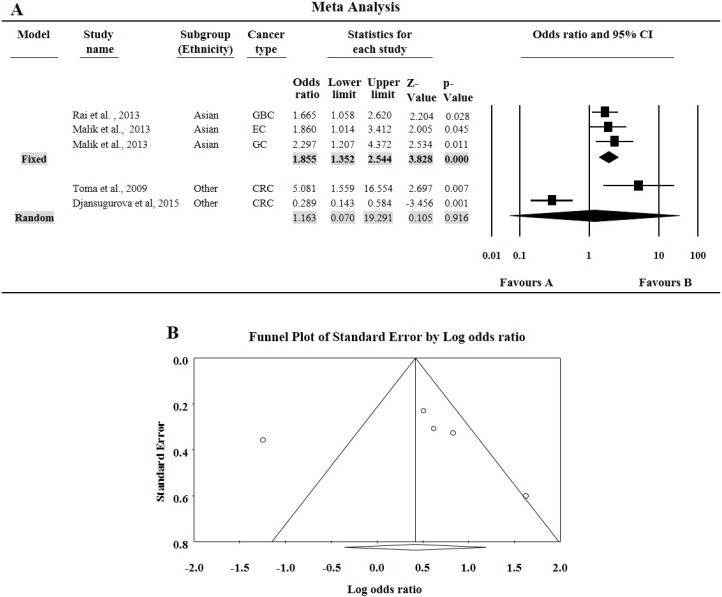
Figure 2.
(A) Forest plots for meta-analysis of DCC rs714 polymorphism (AA vs. GG) and cancer risk after ethnicity based stratification. For each study, the estimates of odds ratio (OR) and 95% confidence interval (CI) were plotted with square and horizontal line. The size of the square points is the relative weight of the respective study. Diamond indicates the pooled OR and its 95% CI; (B) Funnel plot analysis to detect publication bias for the Deleted in colorectal carcinoma (DCC) rs714 polymorphism (AA vs. GG) and overall cancer risk. Each dot represents an individual study for the indicated association. Areas of squares of individual studies are inversely proportional to the variance of the log odds ratios and the horizontal lines represent CIs.

