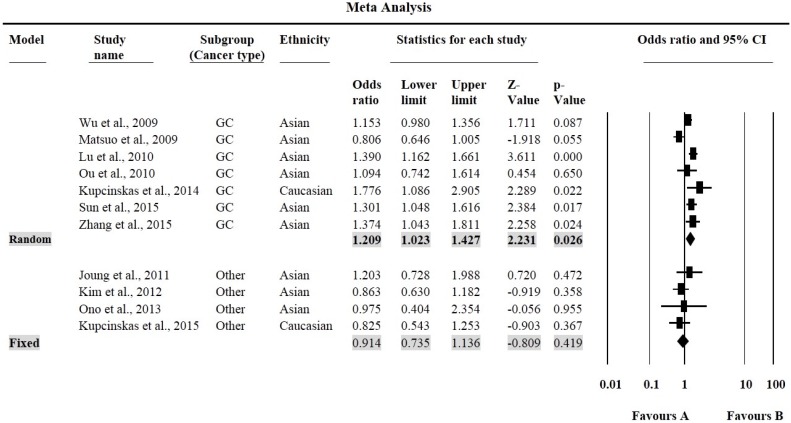
Figure 4.
Forest plots for meta-analysis of PSCA rs2976392 G > A polymorphism (GA vs. GG) and cancer risk stratified by cancer site. For each study, the estimates of OR and 95% CI were plotted with square and horizontal line. The size of the square points is the relative weight of the respective study. Diamond indicates the pooled OR and its 95% CI.

