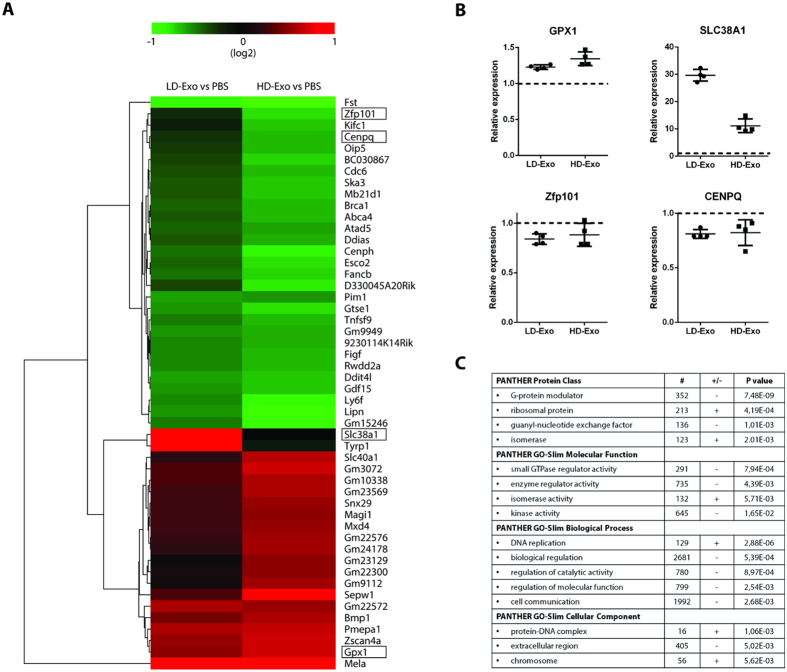
Figure 5. LD-Exo and HD-Exo have different effects on gene expression in recipient cells.
LD-Exo and HD-Exo were isolated as in Fig. 1A and incubated with H5V endothelial cells for 24 h. (A) Heat map displaying genes that were upregulated (red) or downregulated (green) in response to LD-Exo or HD-Exo exposure (>1.5 fold change, q-value < 0.15). (B) RT-qPCR validation of array results. Transcript levels were measured relative to GAPDH and plotted relative to levels in PBS-treated cells. Dot plots represent mean ± SD. (n = 4). (C) Representative GO enrichments differentially regulated (upregulated, + , or downregulated, -) by LD-Exo versus HD-Exo. #, number of genes.

