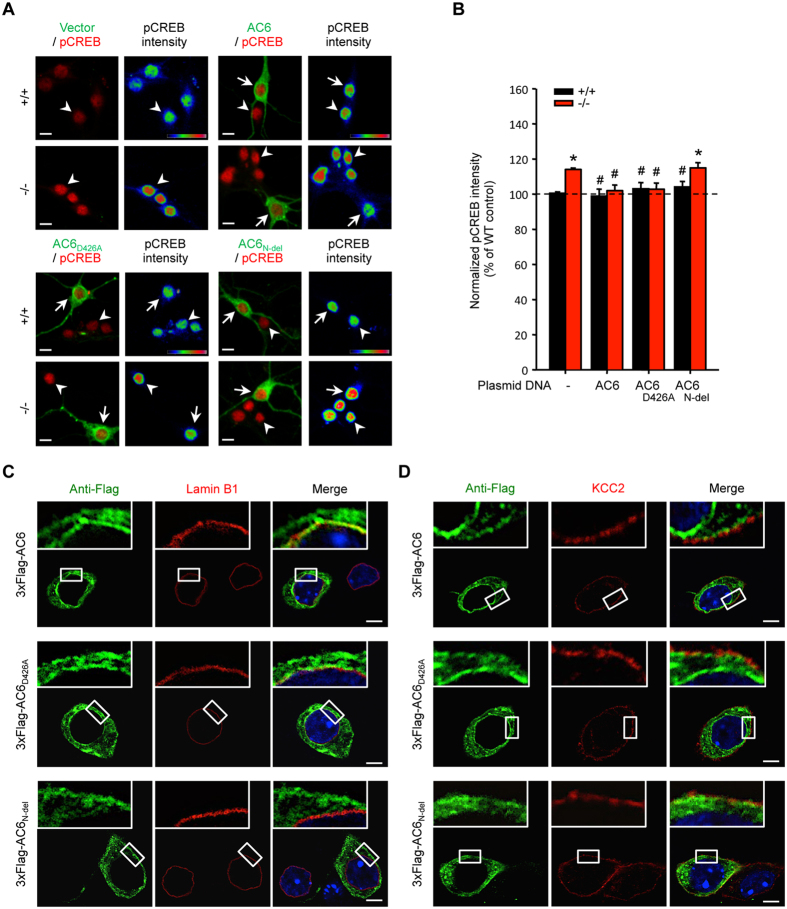
Figure 2. Exogenous expression of AC6 variants (AC6 and AC6D426A), which are located on the plasma and nuclear membranes, normalized the enhanced CREB activity in AC6−/− hippocampal neurons.
(A) Primary hippocampal neurons of AC6+/+ and AC6−/− mice were transfected with 3xFlag-vector, 3xFlag-AC6, 3xFlag-AC6D426A, or 3xFlag-AC6N-del at DIV10 and fixed to analyze the expression of anti-pCREB (red) and anti-flag (green) at DIV14 through immunocytochemical staining. The color bars in the panels labeled as “pCREB intensity” represent the level of pCREB intensity, from low to high fluorescence signals (blue → red). The arrows and arrowheads indicate the transfected and non-transfected primary hippocampal neurons. Scale bar, 10 μm. (B) The intensity of pCREB in each transfected cell was divided by the mean value of the non-transfected AC6+/+ cells and is represented as the means ± SEM (Relative pCREB intensity; non-transfected AC6+/+ cells, n = 436; non-transfected AC6−/− cells, n = 487; 3xFlag-AC6- transfected AC6+/+ cells, n = 22; 3xFlag-AC6- transfected AC6−/− cells, n = 24; 3xFlag-AC6D426A transfected AC6+/+ cells, n = 20; 3xFlag-AC6D426A transfected AC6−/− cells, n = 17; 3xFlag-AC6N-del transfected AC6+/+ cells, n = 20; 3xFlag-AC6N-del transfected AC6−/− cells, n = 18). The data represent the means ± SEM in each group. *p < 0.01, compared with AC6+/+ control neurons; #p < 0.01, compared with AC6−/− control neurons; one-way ANOVA. (C,D) The subcellular localization of exogenously expressed AC6, AC6D426A, or AC6N-del (anti-Flag, green) in transfected AC6+/+ hippocampal neurons (DIV14) was evaluated after immunostaining with (C) the nuclear membrane marker (Lamin B1, red) and (D) the plasma membrane enriched protein (KCC2, red), respectively. Hoechst33258 (blue) was used as the nuclear marker. From top to bottom, the images represent 3xFlag-AC6, 3xFlag-AC6D426A, and 3xFlag-AC6N-del transfected hippocampal neurons; scale bar, 5 μm.

