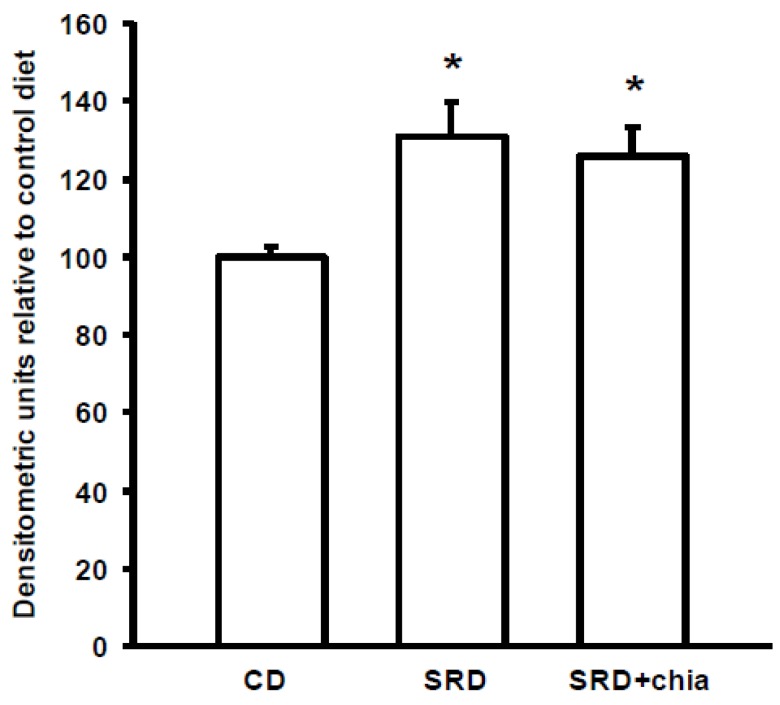
Figure 4.
Heart protein mass level of PPARα in rats fed a control diet (CD), sucrose-rich diet (SRD) or SRD + chia seed (SRD + chia). Top panel: a representative immunoblot of heart PPARα of rats fed a CD, SRD and SRD + chia. Molecular marker is shown on the right. Lane 1 CD; lane 2 SRD; lane 3 SRD + chia. Bottom panel: densitometric immunoblot analysis of heart PPARα protein mass level of rats fed CD, SRD or SRD + chia.. Values are mean, with their standard errors depicted by vertical bars (6 animals per group) and expressed as percentage relative to the control diet. * p < 0.05 SRD and SRD + chia vs. CD.


