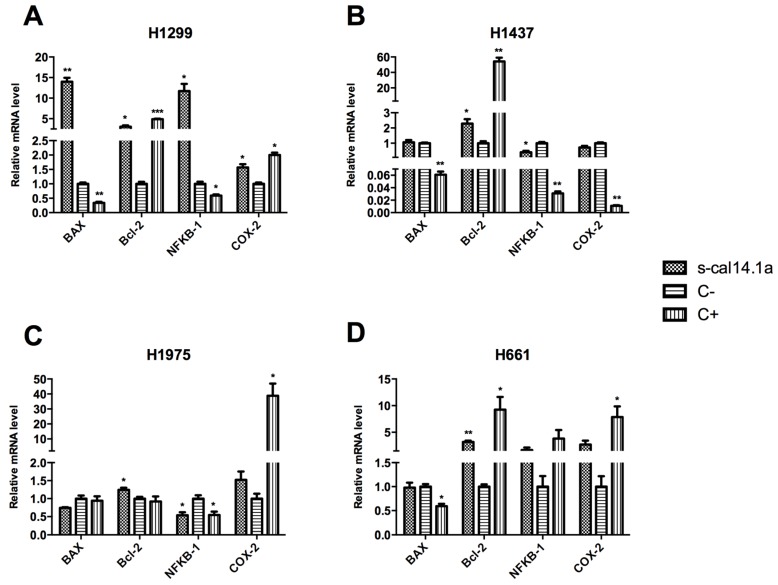
Figure 2.
mRNA expression profile of BAX, Bcl-2, NFκB-1 and COX-2 in H1299 (A); H1437 (B); H1975 (C); and H661 (D) cell lines. A total of 1 × 10⁶ cells were treated with 54 μM of s-cal14.1a for 24 h. Total RNA was isolated and treated with DNase, 2 μg were reverse-transcribed with SuperScript III Kit, using oligodT20 and a random hexamer. mRNA levels were compared by RT-qPCR. Results were normalized to the β-actin gene and expressed as the mean ± SD relative to the negative control (C−, untreated cells). As positive control (C+) cells were treated with 7 μM of staurosporine. Experiments were done in triplicate. * p < 0.05, ** p < 0.01 and *** p < 0.001 vs. C− (unpaired Student’s t-test).

