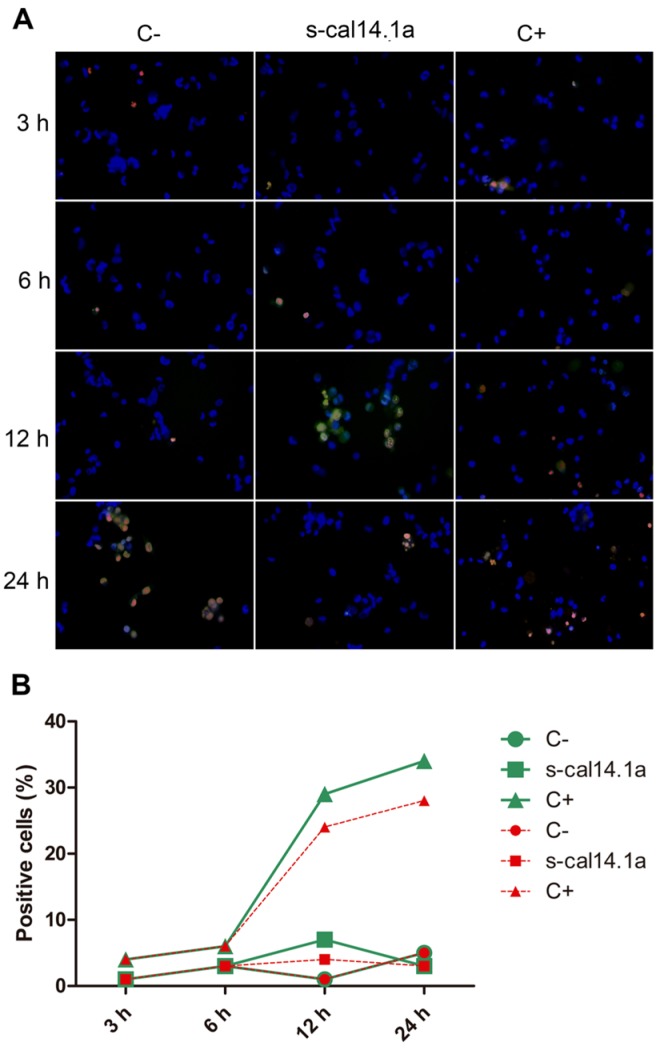
Figure 6.
Time course of caspase-3/7 activation in H661 cell line. (A) Representative image showing untreated cells (C−) and cells treated with s-cal14.1a and C+ (1 μM staurosporine) at 460× overall magnification; (B) Graph showing the number of positive cells to caspase-3 and -7 activation. Cells stained blue were considered as 100%. Results were expressed as the percentage of cells that are positive to caspase-3 and -7 (green) and PI (red).

