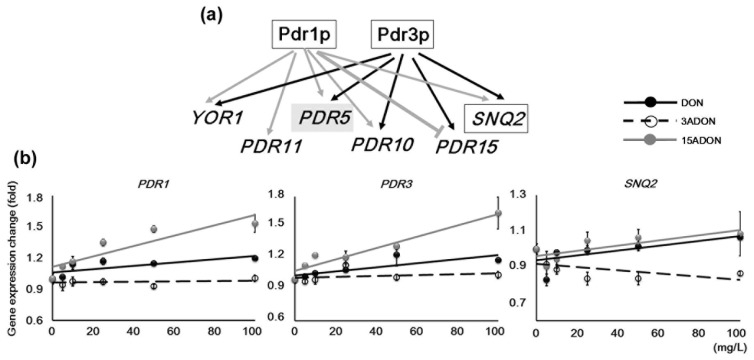
Figure 3.
Expression changes of pleiotropic drug resistance (PDR) genes. (a) A simplified pleiotropic drug resistance regulation system, which was compiled by referring to a previous report [21]. Genes in boxes were examined in this study. Three capital letters with Italics indicates a gene; two small letters following a capital letter indicates a coding protein; (b) Concentration-dependent expression changes of PDR genes obtained by semi-quantitative polymerase chain reaction (PCR). ACT1 expression data in each sample were used for normalization. Approximate trend lines are shown. Bars = standard error; n = 3. p-value of ANOVA < 0.01, except for SNQ2.

