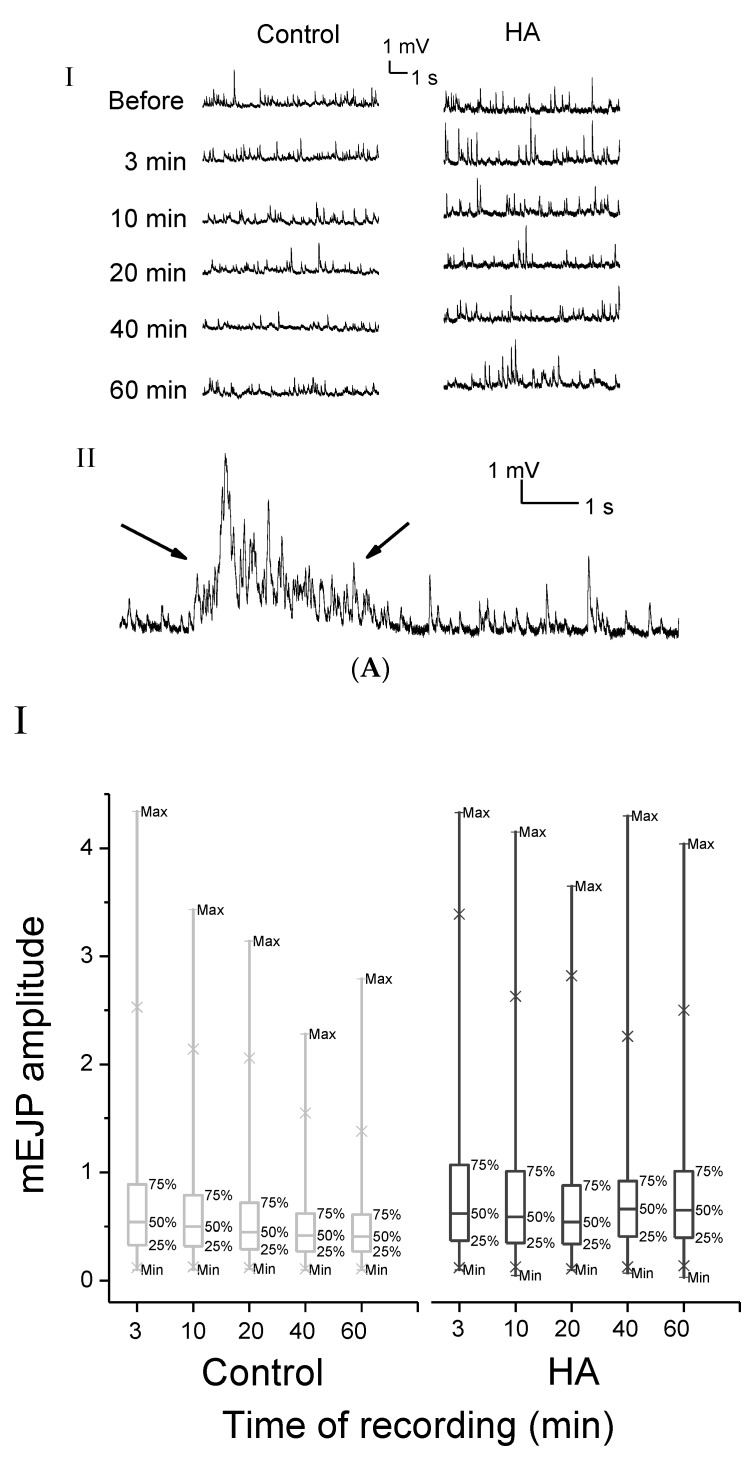
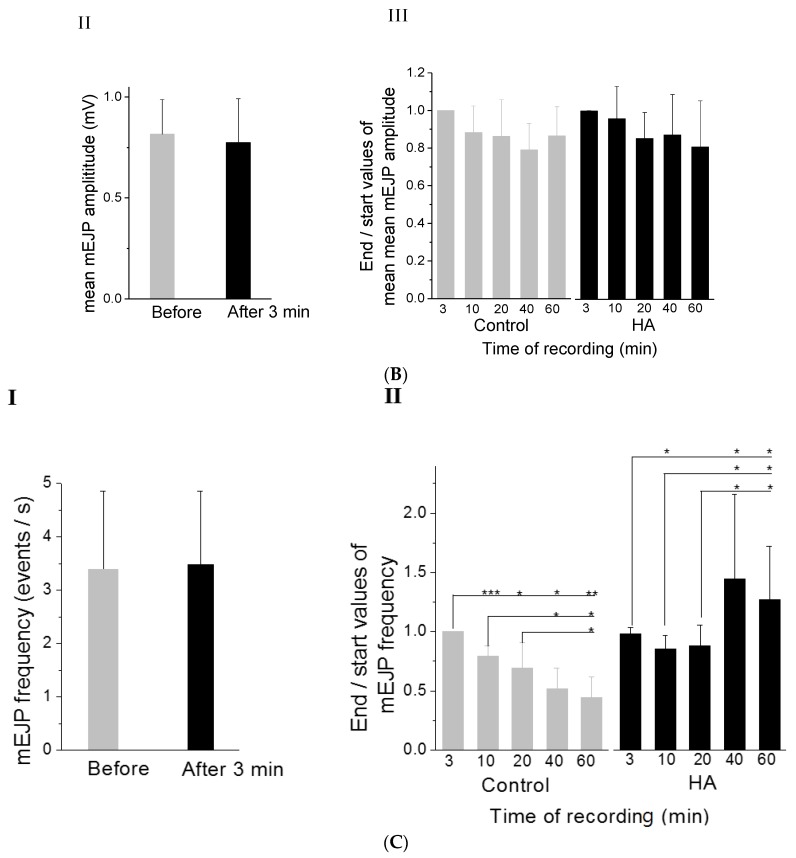
Figure 2.
HA increased the frequency of mEJPs at the Drosophila neuromuscular junction. (A) I, representative of mEJP traces in the control and in the presence of HA (2.5 × 10⁻⁶ M). II, overlap and summation of mEJPs recorded 20 min after HA application, which occurred in about 33% of total recordings. Arrows indicate the irregular mEJPs. (B) analysis of mEJP amplitudes; HA did not affect the average amplitude of mEJPs. I, box plots of mEJPs amplitudes. II, mEJPs amplitude before and at 3 min after HA application showing no significant difference; III, mean mEJPs amplitude at different time points (3, 10, 20, 40, and 60 min) in the control and HA application were normalized to the initial mEJPs amplitude in the control and HA application, separately. No significant difference was observed with time on mEJPs amplitude in both control and HA application (p > 0.05). (C) analysis of mJPs frequencies, HA induced a significant enhancement in the frequency of mEJPs. I, mEJP frequency before and after 3 min of HA application; there is no significant difference (p > 0.05); II, mEJP frequency at different time points (3, 10, 20, 40, and 60 min) in the control and HA application were normalized to the initial mEJP frequency in the control and HA application, separately. mEJP frequency in the control showing significant decrease with time, whereas HA induced a significant increase at 40 and 60 min. Notably, the start and end values of mEJPs amplitude/or frequency in (C) are the EJP amplitude/or frequency at 3 min after application and other different recording times, respectively. The values reported in (C) are the mean ± SD. HA, n = 7; control n = 6. Statistical significance was determined by Student’s t-test, and significant values were set at * p < 0.05 and ** p < 0.01, *** p < 0.001.


