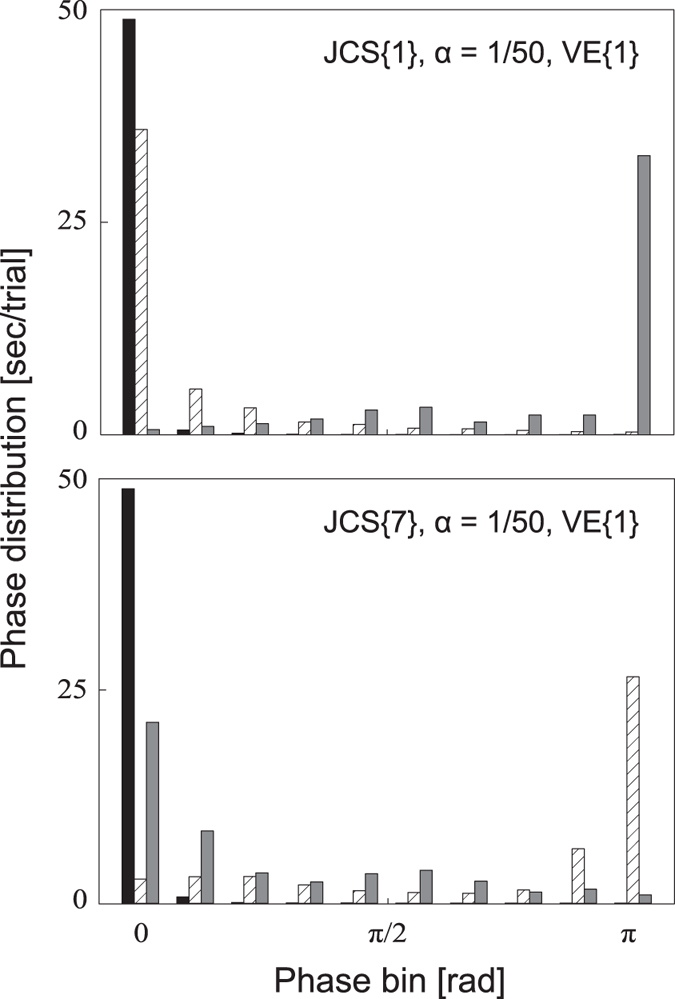
Figure 2. Two examples of phase distribution.

Phase difference between two adjacent joints is separated into ten bins. The sum of each coloured bar is 50 s (the whole trial length). Black, brace, and grey bars represent MP-ankle, ankle-knee, and knee-hip phase distributions, respectively. Each condition is shown in the top-right corner of each figure.
