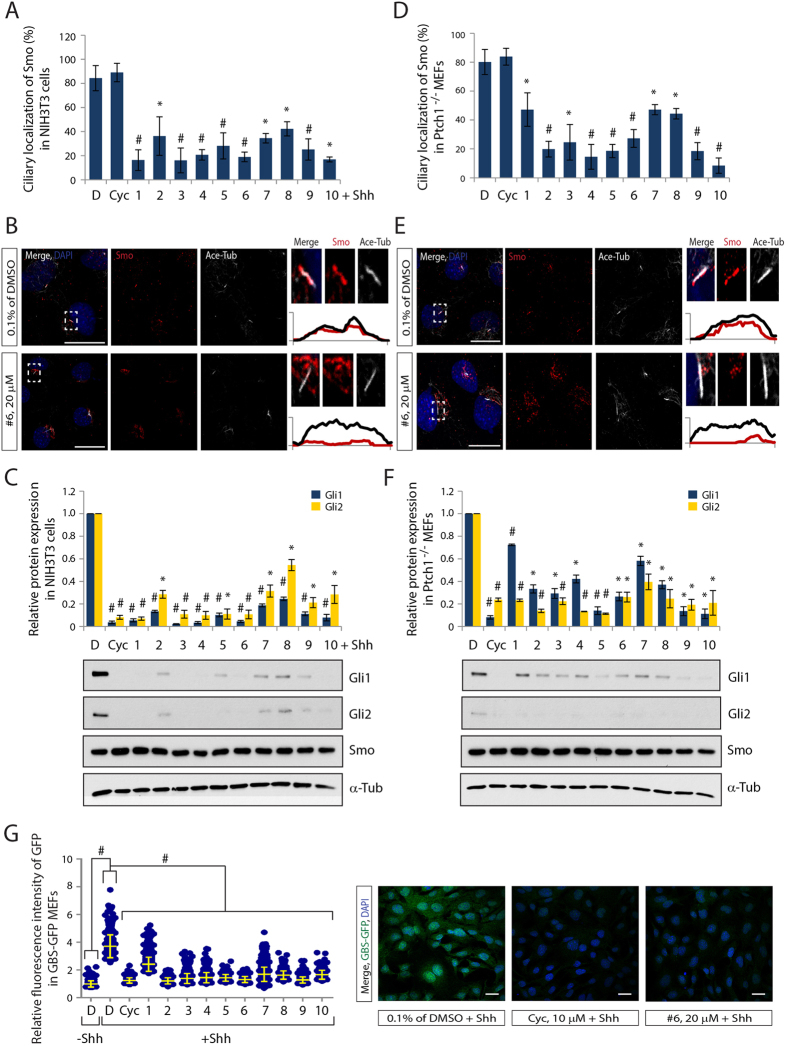
Figure 2. All small molecules effectively inhibit endogenous Smo localization to PC and Hh target gene activation.
(A,D) Quantification of ciliary Smo, (B,E) representative images of CLSM and (C,F) the expression levels of Gli1, Gli2 and Smo protein after treatment with compound 1–10 in NIH3T3 cells (A–C) or Ptch1−/− MEFs (D–F). Smo and PC were stained with antibodies to Smo and Acetylated-Tubulin (Ace-Tub) respectively. Graphs indicate quantification of immunoblot data that show the mean fold change of protein normalized to α-Tub levels. (G) Quantification of fluorescence intensity and representative CLSM images of GBS-GFP MEFs after treatment with compound 1–10. The Gli activities were visualized by GFP staining. Scale bar = 25 μm. > 100 cilia were analyzed per condition. All error bars represent the mean SD of three independent experiments. A two tailed unpaired t-test (A,C,D,F) and a one-way ANOVA (G) are used for statistical data analysis. (*p < 0.01, #p < 0.001) D = DMSO, 0.1%; Cyc, 10 μM; compound 1–4, 10 μM; compound 5–10, 20 μM.

