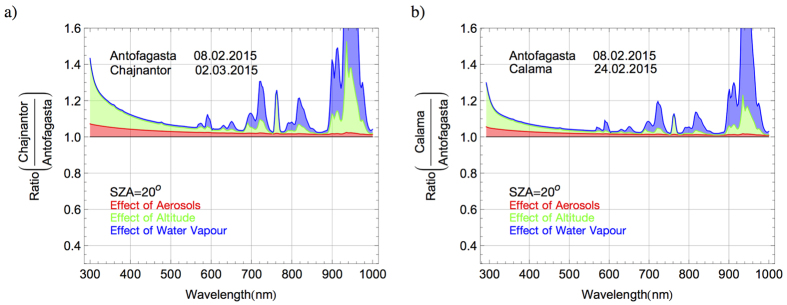
Figure 11.
(a) Ratio between the solar spectra modeled (at SZA = 20°) assuming the condition observed (see dates in the plot) on the Chajnantor Plateau and in Antofagasta. The shaded areas indicate the effects of the different aerosol loading (red area), the shorter optical path length (green area), and the different Precipitable Water (PW) (blue area). (b) Ratio between the solar spectra modeled (at SZA = 20°) assuming the condition observed (see dates in the plot) in Calama and in Antofagasta. The shaded areas indicate the effects of the different aerosol loading (red area), the shorter optical path length (green area), and the different Precipitable Water (PW) (blue area).

