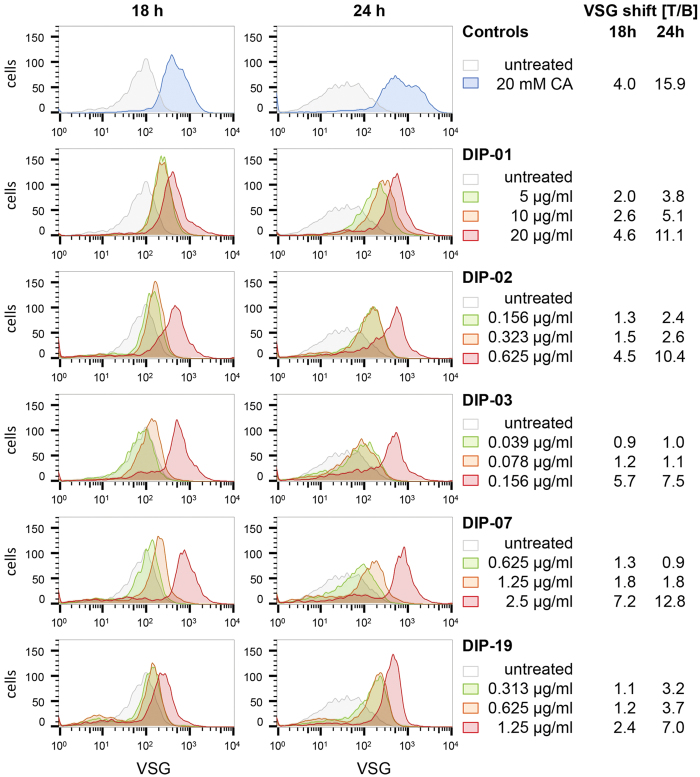
Figure 3. Loss of VSG after treatment with 20 mM CA or various concentrations of DIP compounds at 37 °C.
The density of the VSG coat was monitored by staining with anti-VSG221 antibodies and flow cytometry. All assays were performed in triplicate, using one 96-well plate for each time-point (18 and 24 h); the untreated and CA-treated samples on each plate thus serve as controls for the whole series measured per time-point. To display the dose-dependent VSG shifts, representative curves of different DIP concentrations were plotted together with the corresponding untreated control. MFI: median fluorescence intensity. T/B: VSG changes are expressed as a ratio of the MFI after treatment to the MFI of the untreated control. Full flow cytometry data are available in Table S4.

