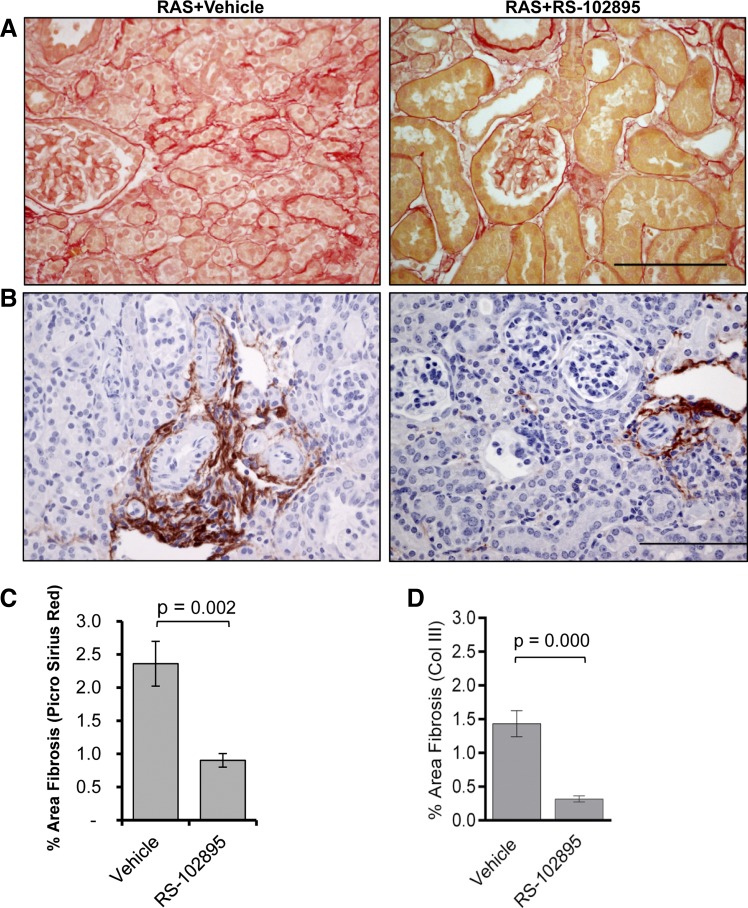
Fig. 7.
CCR2 inhibitor showed reduced fibrosis in the stenotic kidney. A: representative histological images from RAS mice treated with CCR2 inhibitor (RS-102895) or vehicle (water) as stained with picro sirius red at ×400, showing reduced fibrosis in the stenotic kidneys of mice treated with CCR2 inhibitor. Scale bar = 100 μm. B: representative histological images from RAS mice treated with CCR2 inhibitor (RS-102895) or vehicle (water) as stained with collagen III at ×400, showing reduced fibrosis in the stenotic kidneys of mice treated with CCR2 inhibitor. Scale bar = 100 μm. C: comparison of fibrosis between RAS mice treated with CCR2 inhibitor or vehicle. Percentage of fibrosis was measured over the whole cortical surface by percent area positive for picro sirius red at ×200 magnification. D: comparison of fibrosis between RAS mice treated with CCR2 inhibitor or vehicle. Percentage of fibrosis was measured over the whole cortical surface by percent area positive for collagen III at ×200 magnification. Values are means ± SE.

