Fig. 9.
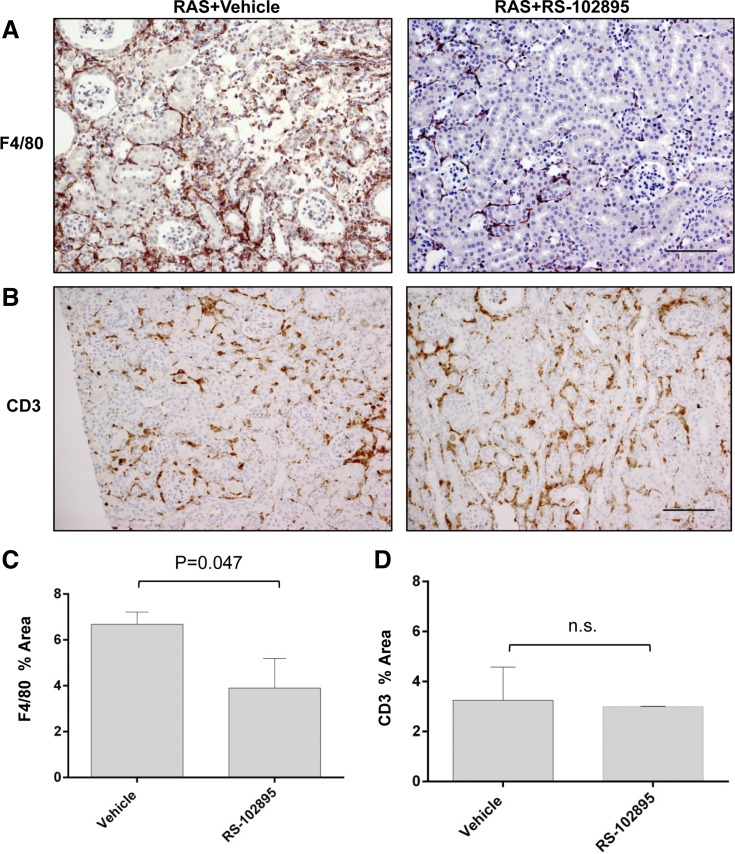
CCR2 inhibition decreased F4/80 percent area in the stenotic kidney with no change in CD3 percent area. A: representative histological images of stenotic kidney of RAS mice treated with CCR2 inhibitor (RS-102895) or vehicle (water) as stained with anti-F4/80 at ×200. B: representative histological images of stenotic kidney of RAS mice treated with CCR2 inhibitor (RS-102895) or vehicle (water) as stained with CD3. Images were taken at ×200. C: extent of macrophage infiltration as assessed by quantifying percent area positive for F4/80 stains. Assessments were done at ×200 magnification over the whole cortex using color-assisted image analysis. D: extent of T cell infiltration assessed by CD3 stains at ×200 magnification. Scale bar = 100 μm. Values are means ± SE.

