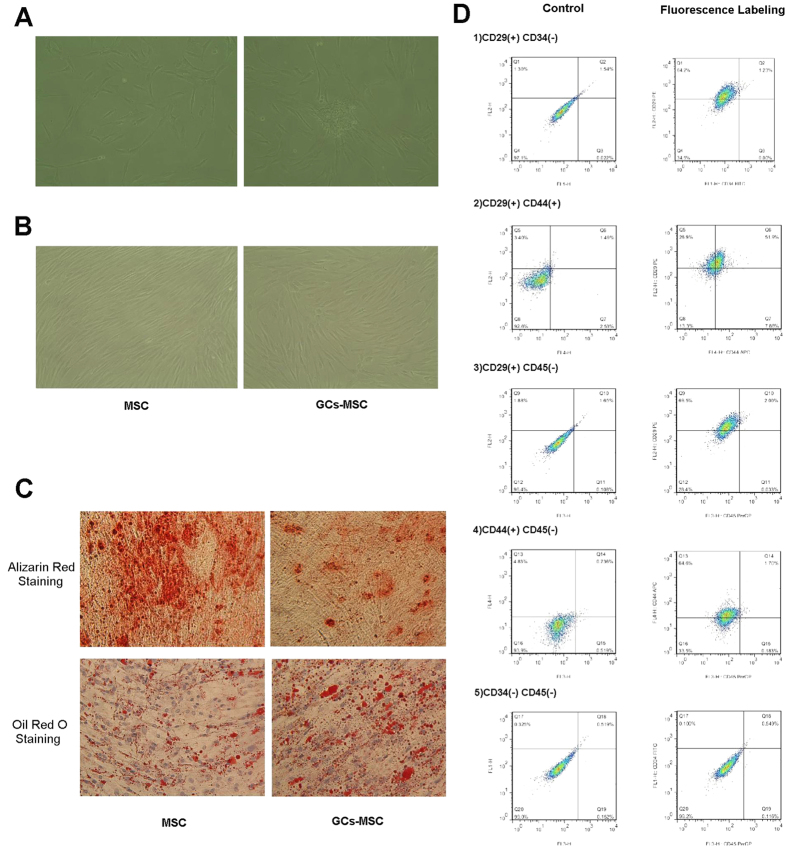
Figure 1. The osteogenic differentiation capacity of GCs-MSC was subdued and the adipogenesis differentiation capacity was enhanced when compared with normal MSCs.
Images (100×) taken by inverted microscope showed MSCs in primary culture on the 7th day (A) and 12th day (B). GC-MSCs showed slower cell reproduction and some morphological variation compared with normal MSCs. When MSCs and GC-MSCs reached 80%–90% confluence, they were treated with osteoblast differentiation medium and adipogenic differentiation medium. Alizarin red S staining and Oil Red O staining was performed at 14 days (C), which show the change of coloration in GC-MSCs after staining. The double channel flow cytometry (D) indicated that our cells were human MSCs. Images showing negative control without fluorescence antibodies are in the left column. The displacement of splashes on the CD29-PE and CD44-APC channel are obvious.

