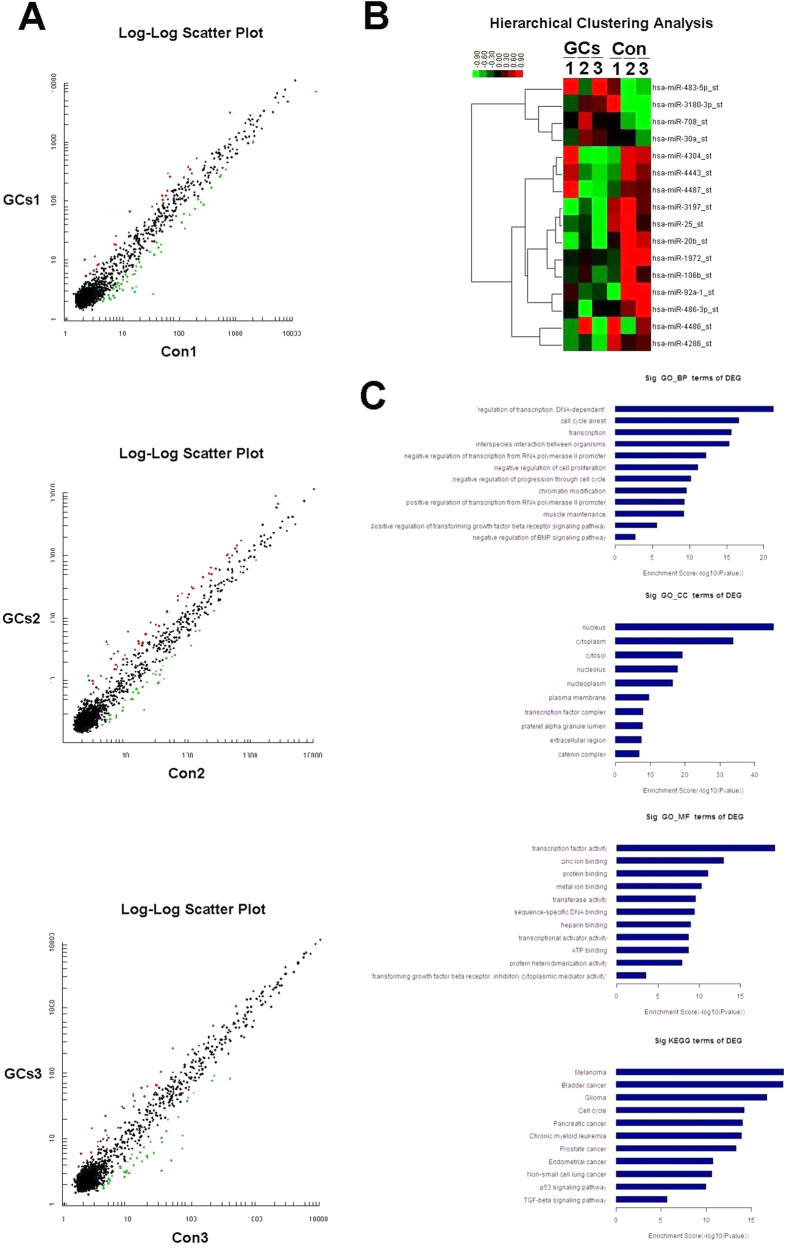
Figure 2. Microarray analysis revealed differential expression profiling of miRs between MSCs of GCs Group and Control Group.
By microarray and subsequent related analysis, select miRs were chosen for the following studies. Three Log-Log Scatter Plots (A) show the comparison of each pair in miRs microarray analysis. Splashes with red color stand for those overexpressed miRs and green stand for those underexpressed miRs between each pair, which we are shown in Supplementary Tables 3 to 5. The hierarchical clustering (B) in the lower right corner show the differentially expressed miRs between GCs Groups and Control Groups, which we selected in Suppplementary Table 6 and were differentially expressed (p < 0.05). The color scale shown on the top illustrates the relative expression level of the indicated miRs across all samples: red denotes high expression levels, whereas green denotes low expression levels. Significant GO enrichment analysis and KEGG pathway analysis (C) predicted the most likely Biological Process (BP), Cellular Component (CC), Molecular Function (MF), and pathways. The vertical axis is the GO or pathway category, and the horizontal axis is the –log10 p value of the GO category or the enrichment of pathways.

