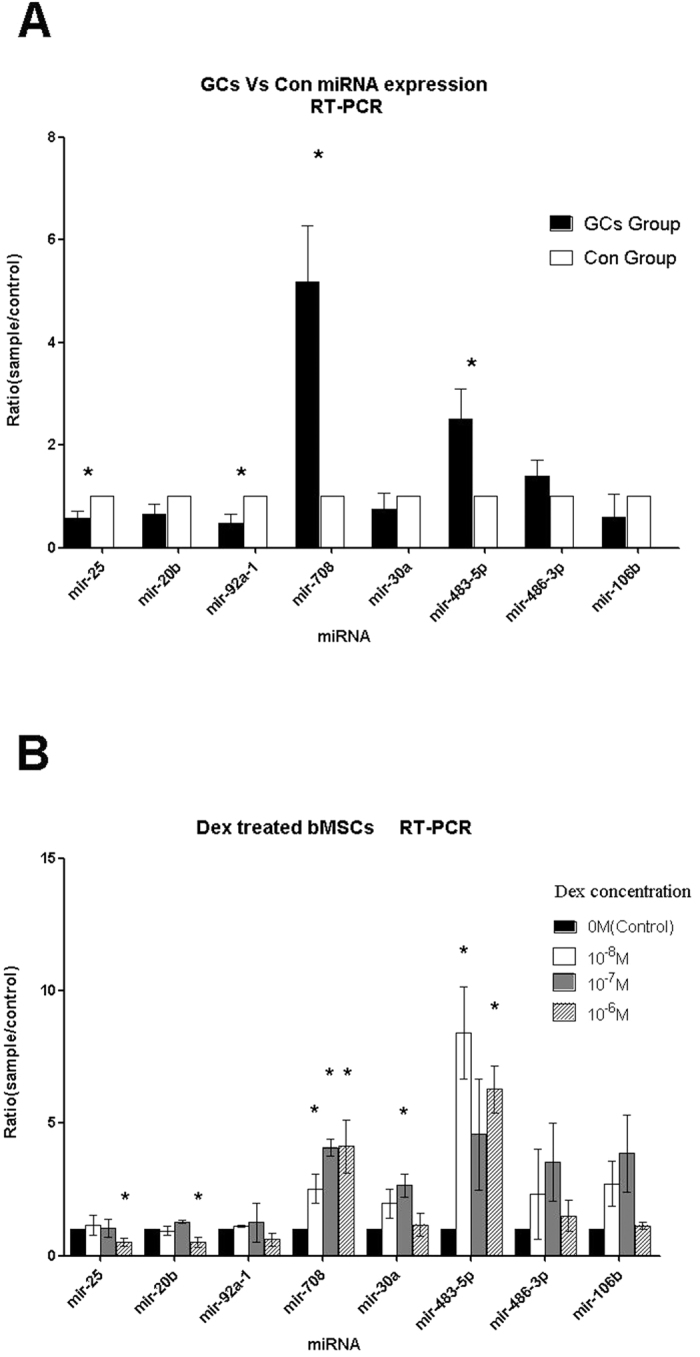
Figure 3. GCs induce high miR-708 expression in MSCs.

The RT-PCR verification after Microarray analysis and GC intervention analysis verified and screened our miRs selected by microarray analysis for further studies. The results showed miR-708 high expression in vivo (A) and in vitro (B), which were stabilized and consistent with our microarray analysis. In Histogram A, miRs are listed on the X-axis, and the Y-axis refers to the relative expression levels of miRs between GCs Group MSCs and Con Group MSCs. The symbol * means p < 0.05 by significant paired t-test. Histogram B showed the RT-PCR results in the experiments with gradient concentration Dex treated MSCs in vitro. The symbol * means p < 0.05 by significant paired t-test. The legend in the top right corner shows the gradient concentration (0 M, 10−8 M, 10−7 M, and 10−6 M) of Dexamethasone.
