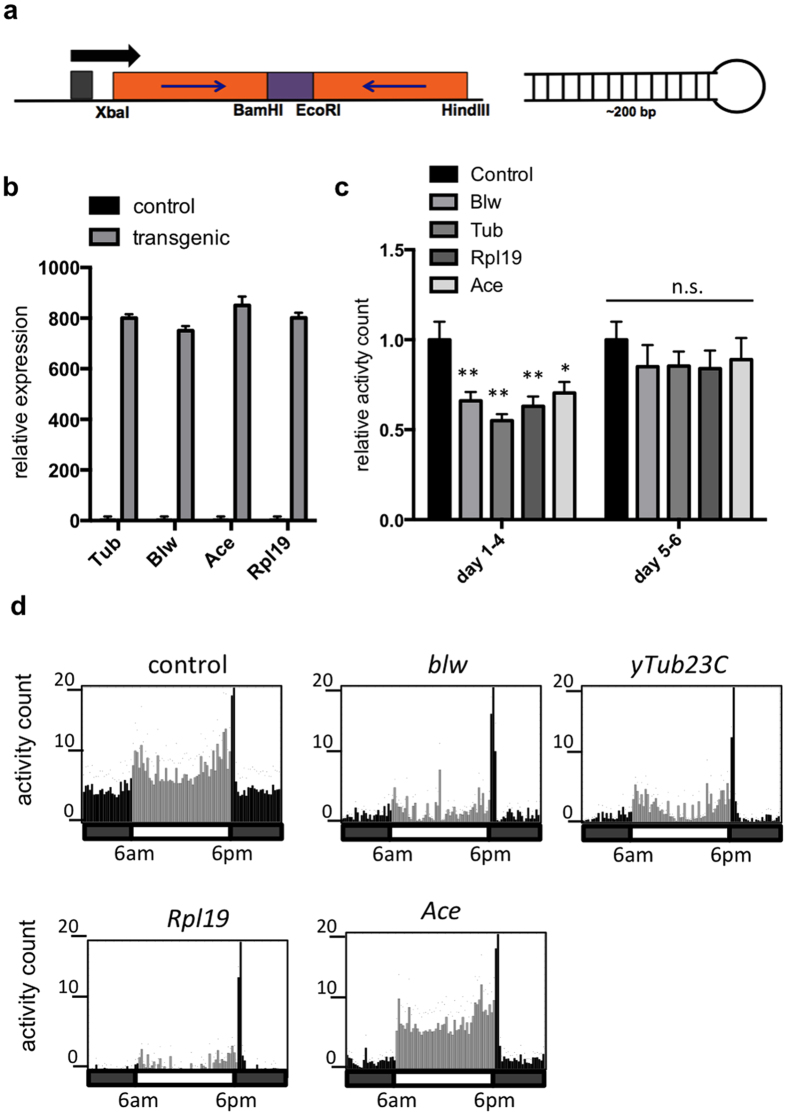
Figure 2. D. suzukii adults fed on yeast expressing dsRNA have decreased locomotor activity levels.
(a) Map of transformation vector for expression of hairpin dsRNA in S. cerevisiae. ~200 bp of D. suzukii target gene sequence was inserted into p406TEF1 to form inverted repeats linked by 74 bp of intron sequence from the white gene. Black arrow indicates direction of transcription. (b) Expression of dsRNA in S. cerevisiae. Expression was quantified with RT-qPCR and was normalized against housekeeping gene actin. Data represent mean and s.e.m. of three technical replicates. (c) Locomotor activity levels in D. suzukii following a three-day treatment with yeast expressing dsRNA targeting D. suzukii blw, yTub23C, Ace, and RpL19. Male adult flies were fed ad libitum with a choice between artificial diet and live yeast for three days. Activity was recorded for 6 days after the feeding period using the DAMS. The first through the fourth days of recording were averaged together, and days 5 and 6 were averaged. Data represent mean and s.e.m. of 3 independent experiments, and a total of 96 flies were tested per treatment. Each experiment was normalized to the average of the control treatment. One-way ANOVA was performed (p = 0.0009) and significance relative to the control was determined by post hoc Dunnett corrected t-test (*indicates p < 0.05 and **indicates p < 0.01). (d) Activity levels plotted over the second day of recording following three days of feeding treatment. Each bar represents average activity counts in 15-minute increments. Black bars indicate lights off and grey bars represent lights on. Presence or absence of light as well as the timing of light transition are also indicated in the horizontal bar underneath each activity graph; light turns on at 6am and turns off at 6pm each day of recording. Each activity graph represents an average of 32 flies in one experiment. Representative activity graphs are shown here.

