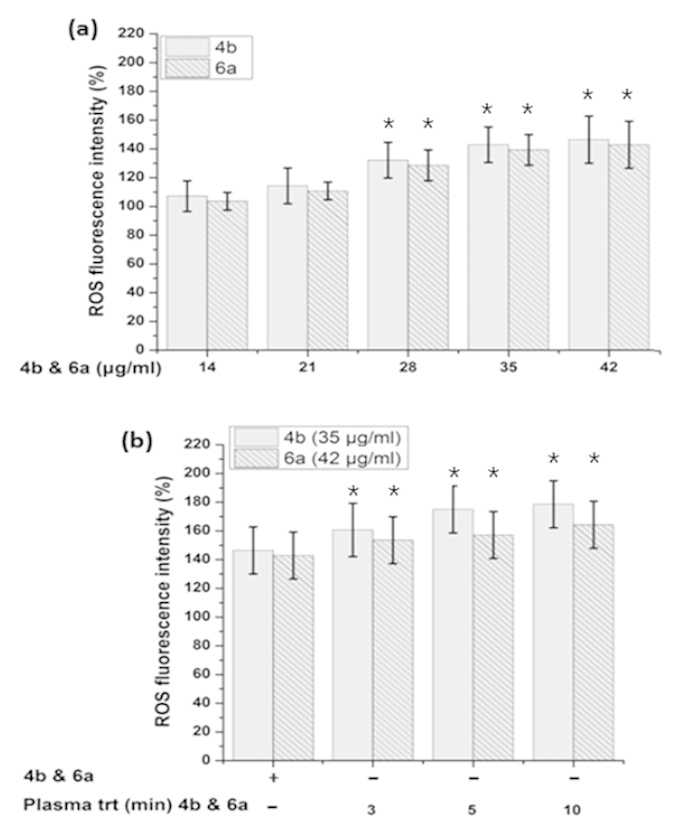
Figure 11. Intracellular ROS detection.

The ROS detected from B16F10 cells, incubated with (a) as-synthesized and (b) plasma-treated 4b and 6a compounds. The data were expressed as a percentage of the control (normalized to 100%) from three independent experiments with mean ± standard deviation and were analyzed using Student’s t-tests, *p < 0.05.
