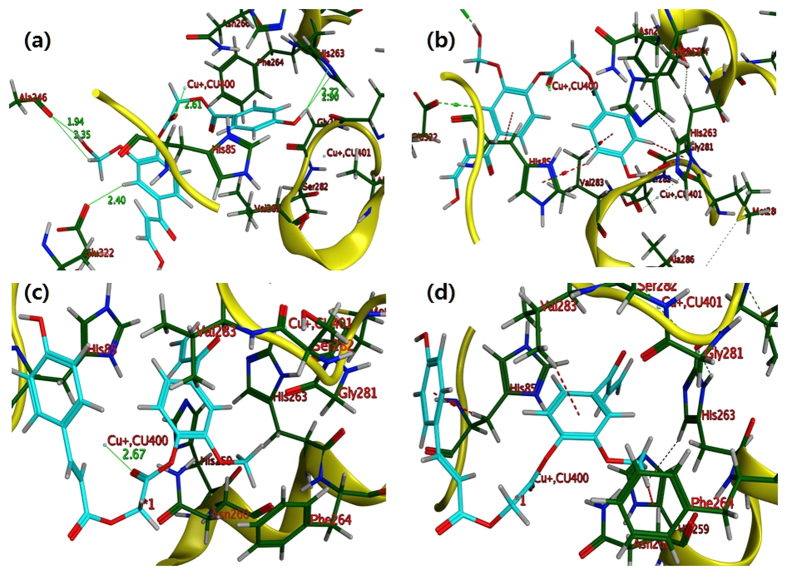
Figure 7. Docking poses of plasma treated ED compounds in 3D space.
The molecules are shown in cyan color (stick mode) and receptor is shown in yellow ribbons and cartoons. π-H interactions are represented by red dashed lines. (a) Hydrogen bonding and interaction with CU: 400, ligand 4b with His85 and Ala246 shown in green colored solid line. (b) π-H interaction of 4b with Val283 and His263 (c) Interaction of ligand 6a with CU:400. (d) π-H interactions of 6a with His85 and His263 and Val283.

