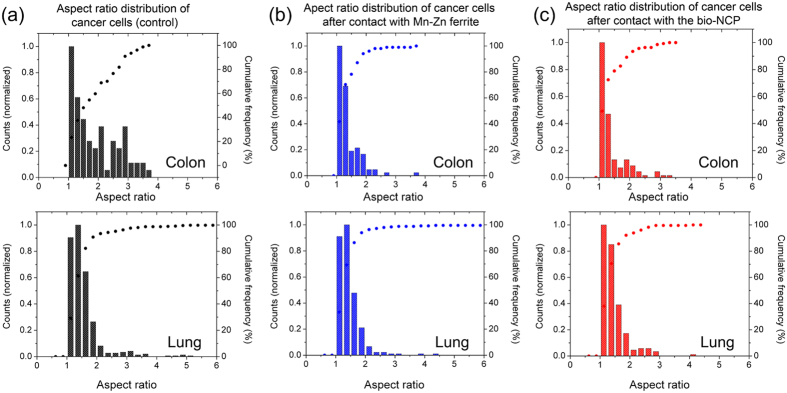
Figure 3.
Aspect ratio distributions represented by bars for (a) colon (HCT116) and lung (3LL) cancer control cells and for the cells after 2 h contact with (b) Mn-Zn ferrite and (c) bio-NCP. The morphological changes, more evident in the colon cancer cells after contact with both Mn-Zn ferrite and the bio-NCP, are reflected by the sharper distributions. In each figure the symbols represent the cumulative frequency of the aspect-ratios.

