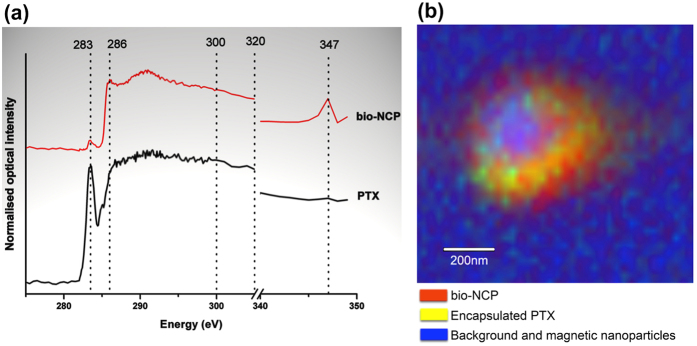
Figure 5.
NEXAFS spectra for PTX and the bio-NCP (a). The PTX spectrum shows a characteristic peak at 283 eV, while the bio-NCP spectrum shows characteristic transitions at 286 eV, 291 eV and 347 eV. In (b), the map of the chemical composition of the bio-NCP + PTX obtained by STXM after performing singular value decomposition on images collected using X-rays with the following energies: 275 eV, 283 eV, 286 eV, 300 eV, 320 eV and 347 eV. The PTX is represented in yellow, the bio-NCP in red and the blue colour corresponds to background materials, including the magnetic nanoparticles. The green spots denote regions with low PTX concentration. The compositional map shows the distribution of the PTX in the polymeric nHAP shell.

