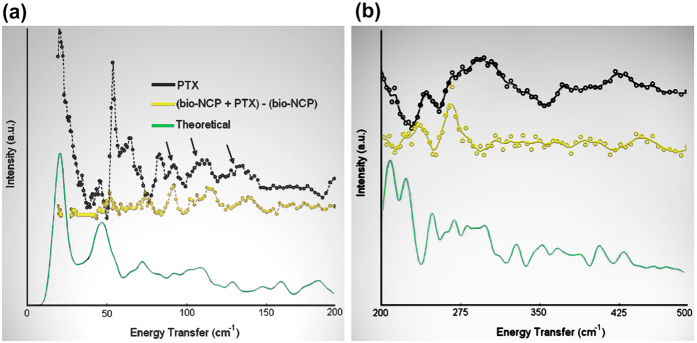
Figure 6.
INS data collected at FDS between (a) 20 and 200 cm−1 and (b) between 200 and 500 cm−1. In (a,b) the black curve shows the PTX data, while the contribution from the encapsulated drug, shown in yellow, is depicted by the difference spectrum between the (bio-NCP + PTX) and (bio-NCP) spectra. The bio-NCP data is not shown. INS spectra obtained by DFT calculations for the free molecule are shown in green. In the difference spectrum, the modes assigned to acetyl and phenyl groups, observed below 80 cm−1, are not detected, while vibrations from the terpene ring, indicated by arrows, remain visible in the encapsulated drug. This indicates that the mobility of the biologically active groups of PTX is highly constrained.

