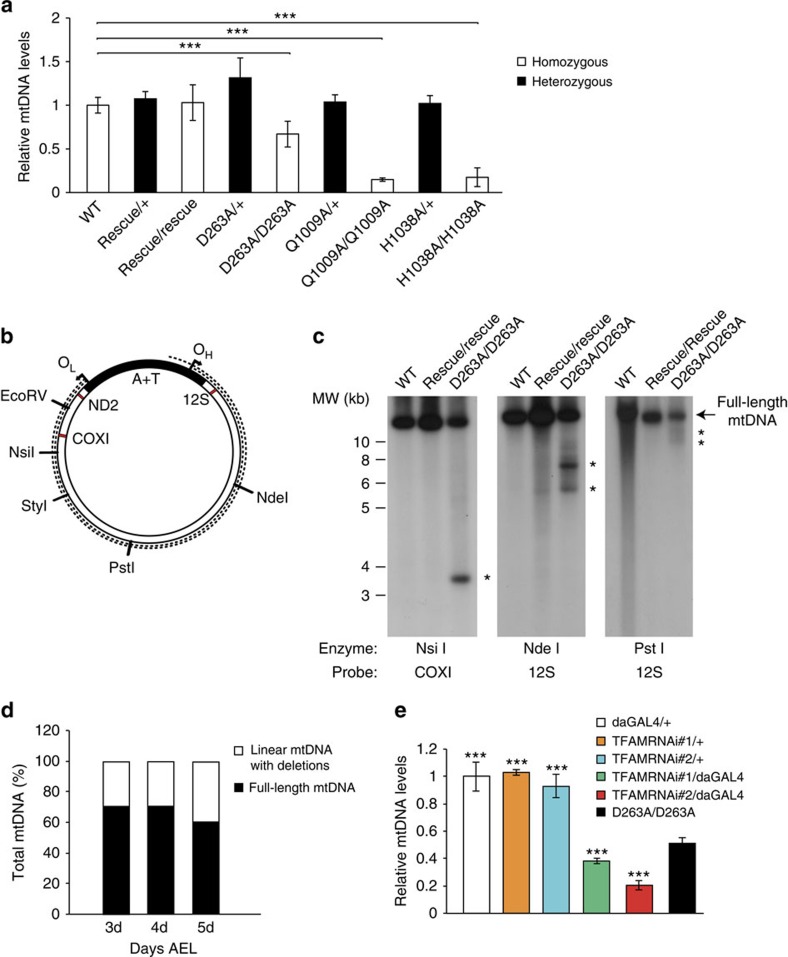
Figure 5. Quantification of mtDNA copy number and analysis of mtDNA integrity.
(a) Quantification of mtDNA levels in genomically engineered DmPOLγA flies. Steady-state levels of mtDNA were determined by quantitative PCR in 5-day-old homozygous (white bar) and heterozygous (black bar) larvae. Data represent two to four independent experiments. Kruskal–Wallis test with Dunnett's post hoc test. ***P<0.001. Error bars represent s.d. n=4–6. (b) Schematic representation of Drosophila mtDNA. The dotted lines indicate linear mtDNA molecules with deletions. Restriction endonucleases used for mapping the deletions in the mtDNA are indicated. Red bars represent oligonucleotide probes used to map the mtDNA deletions. OH (origin of replication for heavy strand of mtDNA) and OL (origin of replication for light strand of mtDNA), A+T (control region of fly mtDNA). (c) Mapping mtDNA deletions. MtDNA was cut with NsiI (left panel), NdeI (middle panel) or PstI (right panel). MtDNA deletions were mapped with COXI and 12S rRNA probes. (d) The relative amount of mtDNA deletions increases throughout the larval development in homozygous DmPOLγA D263A mutants. Total DNA was extracted from 3-day-, 4-day- and 5-day-old homozygous D263A exo− larvae and restricted with StyI. MtDNA deletions were detected using a COXI probe. Data represent two independent experiments. (e) Ubiquitous TFAM knockdown leads to severe mtDNA depletion. TFAM knockdown lead to a more pronounced decrease in mtDNA copy number in comparison with homozygous exo− larvae. All genotypes were compared against the homozygous exo− larvae (D263A/D263A). Data represent two independent experiments. One-way ANOVA with Dunnett's post hoc test. ***P<0.001. Error bars represent s.d. n=5.

