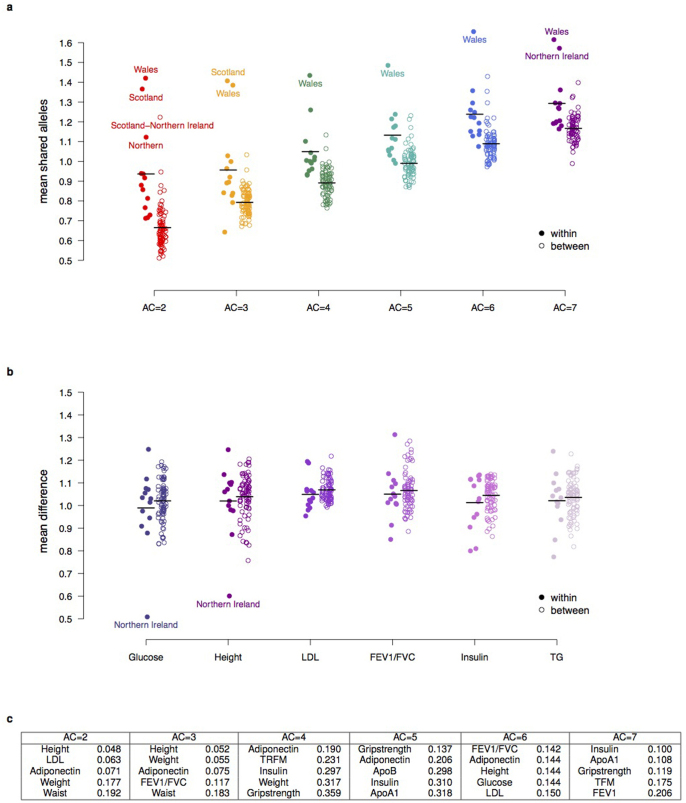
Extended Data Figure 8. UK10K-cohorts, genotype and phenotype similarities within and between regions.
a, b, Dot plots show the genetic (a) and phenotypic distribution (b) of the relationships of 1,139 unrelated TwinsUK individuals by their regional place of birth. To determine the genetic relationships we used the mean number of shared alleles between two individuals within and between regions for allele counts (AC) 2 to 7, where AC is calculated from the whole data set of 3,781 samples. To determine phenotypic similarities we calculated the mean difference between the residualized phenotypes. Genetically-related individuals are more closely related within a region than between regions, while the phenotypic distance measure has similar distributions within and between regions. The mean shared alleles increase with increasing allele count, and simultaneously the within and between distributions converge. c, The five lowest P values for AC 2 to 7 obtained from Mantel tests to determine similarities between genotypes and phenotypes by region. P values were not significant after correcting for multiple testing using the FDR method49. Full trait names are given in Supplementary Table 1.

