
Figure 3. Summary of association results across the UK10K-cohorts study.
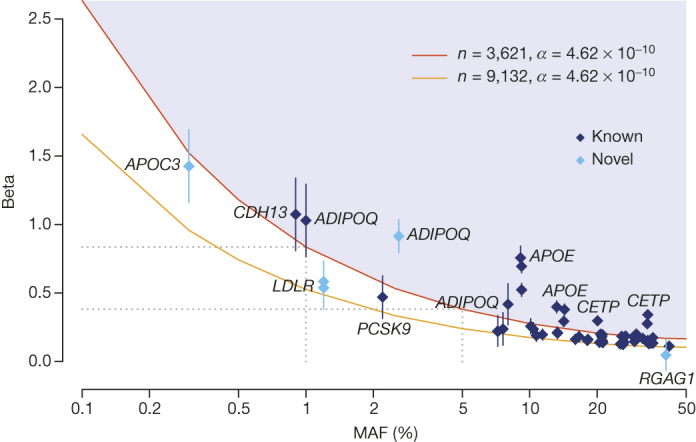
Allelic spectrum for single-marker association results for independent variants identified in the single-variant analysis (Supplementary Table 5). A variant’s effect (absolute value of Beta, expressed in standard deviation units) is given as a function of minor allele frequency (MAF, x axis). Error bars are proportional to the standard error of the beta, variants identifying known loci are dark blue and variants identifying novel signals replicated in independent studies are coloured in light blue. The red and orange lines indicate 80% power at experiment-wide significance level (t-test; P value ≤4.62 × 10⁻¹⁰) for the maximum theoretical sample size for the WGS sample and WGS+GWA, respectively.