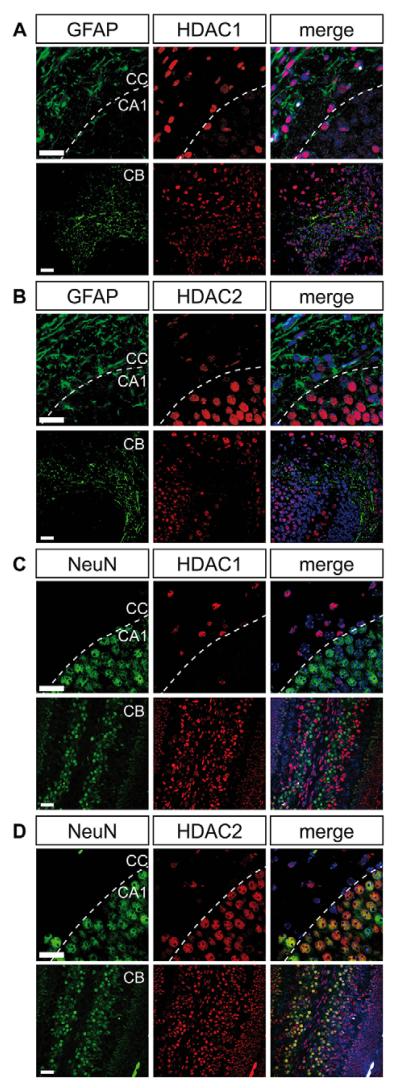
Fig. 1. HDAC1 and HDAC2 display divergent expression patterns in the postnatal wild-type brain.
Fluorescence immunohistochemistry stainings of HDAC1 and HDAC2 in the corpus callosum and the CA1 neuron region of the hippocampus (upper panels) and in the cerebellum (lower panels) on postnatal day 4 (P4). (A,B) Co-staining of astrocyte marker GFAP (green) and HDAC1 (red, A) or HDAC2 (red, B). (C,D) Co-staining of neuronal marker NeuN (green) and HDAC1 (red, C) or HDAC2 (red, D). Nuclei are counterstained with 4′6-diamidino-2-phenylindole (DAPI). The white dashed line indicates the border between the corpus callosum and the CA1 region. Scale bar: 20 μm. CA1, hippocampal CA1 region; CB, cerebellum; CC, corpus callosum.

