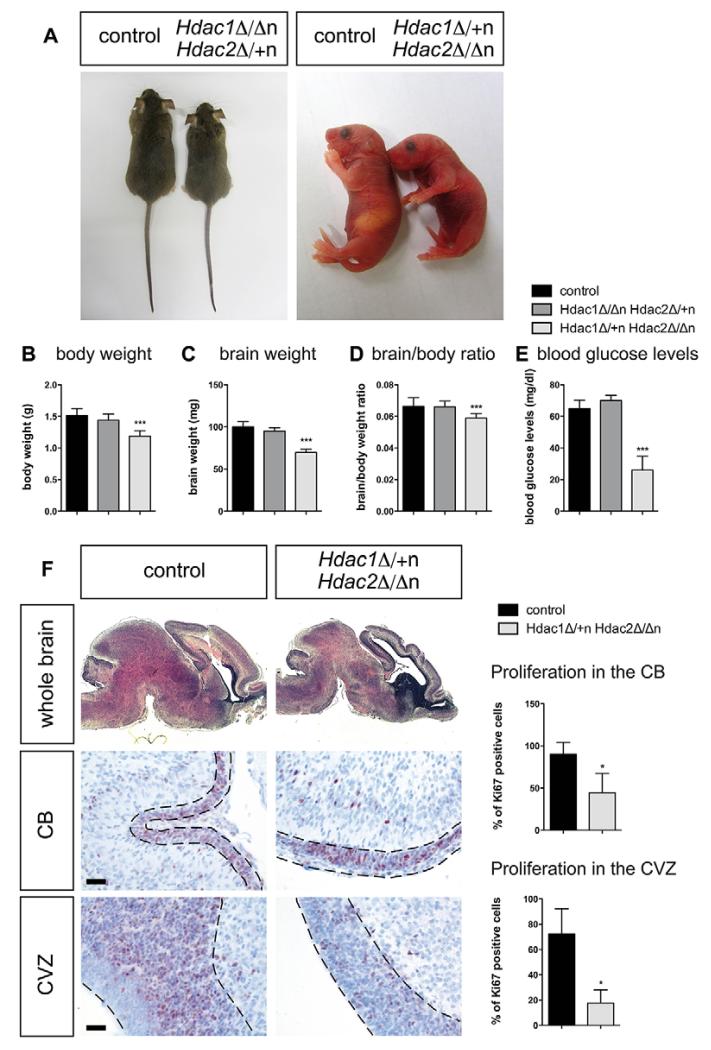
Fig. 5. Divergent phenotypes upon deletion of different combinations of Hdac1/Hdac2 alleles in the brain.
(A) Left panel: representative pictures of a wild-type (left) versus an Hdac1Δ/ΔnHdac2Δ/+n (right) adult littermate. Right panel: representative pictures of a wild-type (left) versus an Hdac1Δ/+nHdac2Δ/Δn (right) newborn littermate. (B-D) Body/brain weights and ratios of P0 control (black, n=16) compared with Hdac1Δ/ΔnHdac2Δ/+n (dark gray, n=5) and Hdac1Δ/+nHdac2Δ/Δn (light gray, n=16) mice. Error bars indicate s.d. ***P<0.001. (E) Blood glucose levels of P0 control (black, n=7) compared with Hdac1Δ/ΔnHdac2Δ/+n (dark gray, n=5) and Hdac1Δ/+nHdac2Δ/Δn (light gray, n=7) mice. Error bars indicate s.d. ***P<0.001. (F) Whole brain: Hematoxylin and Eosin stainings on wild-type control littermates (left) and Hdac1Δ/+nHdac2Δ/Δn (right) paraffin sections. Detailed regions in the brain (cerebellum and cortical ventricular zone): IHC with the proliferation marker Ki67 antigen (brown staining) on wild-type littermates (left) and Hdac1Δ/+nHdac2Δ/Δn (right) paraffin sections. The nuclei are counterstained with Mayer’s hemalaun (blue staining). For quantification, positively stained cells in Hdac1Δ/+nHdac2Δ/Δn (light gray) and corresponding wild-type controls (black) were evaluated by the HistoQuest Software as shown in the graphs on the far right. Scale bars: 20 μm. Error bars indicate s.d. (n=3). *P<0.05. CB, cerebellum; CVZ, cortical ventricular zone.

