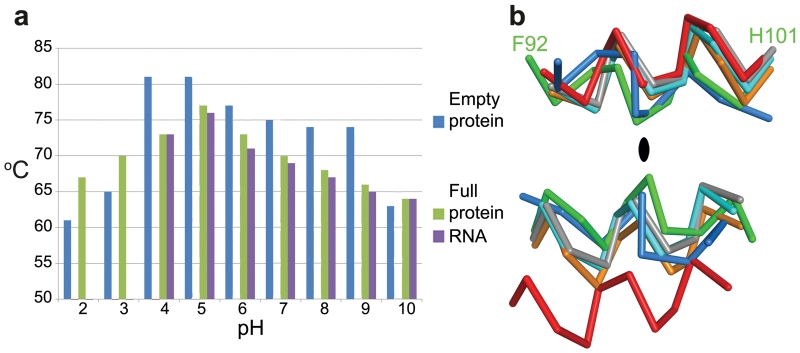
Figure 3. Stability.
a, Summary of thermal shift assays for HAV in the pH range from 2 to 10. Purple and green bars represent RNA release and protein-melting temperatures respectively for full HAV, blue bars show protein melting for the empty particle. RNA release is not detected at low pH due to quenching of the SYTO9 dye. Extended Data Fig. 4 shows raw fluorescence traces. b, The separation of VP2 α-helices at the icosahedral 2-fold of HAV (green, 3.8Å), CrPV (blue, 5.3Å), EV71 (cyan, 7.3Å), polio (grey, 7.6Å ), FMDV (orange, 8.2Å) and 80S-like EV71 (red, 12.2Å).

