
Fig. 1.
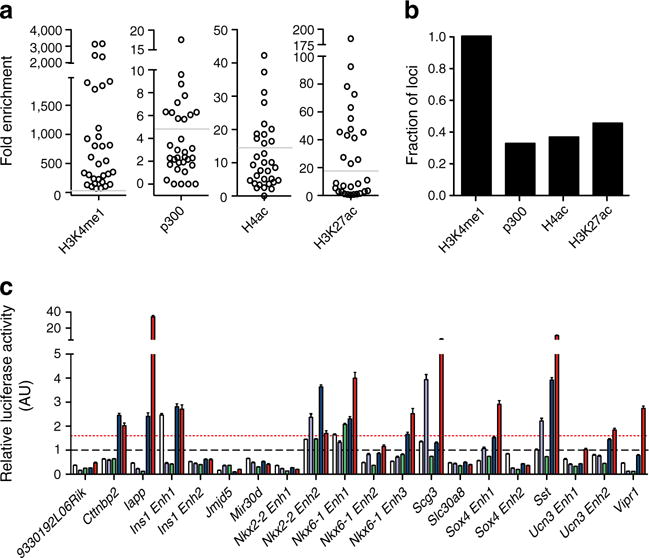
Identified loci have characteristics of functional enhancers. (a) Fold enrichment and (b) fraction of putative enhancer loci enriched for the indicated histone modifications and for p300 recruitment. The horizontal grey lines in (a) indicate the minimum fold enrichment needed for a locus to be considered enriched. (c) Relative luciferase activity levels (arbitrary units [AU]) of selected enhancer loci in HEK293 (white bars), Hepa1-6 (purple bars), mPAC (green bars), αTC-1 (blue bars) and MIN6 (red bars) cells. The black dashed line represents the mean relative luciferase activity of negative control regions in the cell lines, while the red dashed line indicates 2SD above this mean