
Fig. 3.
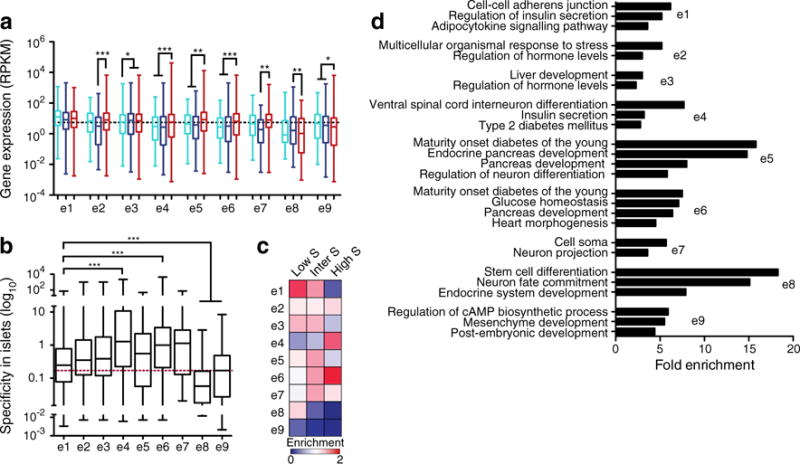
Association of enhancer clusters with genes. (a) Box–whisker plot of expression levels in ESCs (light blue), liver (dark blue) and islets (red) of genes with enhancers in the indicated enhancer clusters. RPKM, reads per kilobase per million mapped reads. (b) Box–whisker plot of the specificity to islets as calculated using 203 SAGE libraries from different mouse tissues [34, 35] for genes associated with enhancers in each enhancer cluster. The red dashed line indicates the median for all expressed genes. (c) Heatmap of the enrichment of genes with low, intermediate or high specificity to islets (S) associated with enhancers in each cluster, relative to random expectation. Darker blue is more deprived, while darker red is more enriched. (d) Fold enrichment of significantly enriched GO and KEGG terms for genes with enhancers in the indicated enhancer clusters. Statistically significant differences in (a) and (b) were detected using a Kruskal–Wallis non-parametric test with a Dunn’s multiple comparison correction; *p<0.05, **p<0.01, ***p<0.001