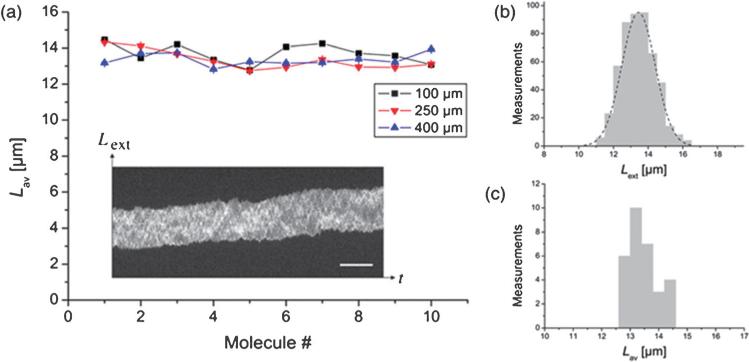
Fig. 12.
(a) Graphs showing the average extension length Lav of 10 different T4 DNA molecules inside a PMMA nanochannel. Lav was measured 100, 250 and 400 μm from the nanochannel entrance for each molecule. The inset shows a typical intensity time-trace of a T4 molecule confined inside the PMMA nanochannel. The scale bar is 10 μm and the time span is 50 s. (b) Histogram of the measured extension lengths Lext of DNA molecule 2 positioned 100 μm from the nanochannel entrance. The average extension, Lav, was found to be 13.4 μm and the standard deviation σav = 1.0 μm. The dashed line shows the Gaussian curve fit. (c) Histogram of the measured Lav presented in (a). The overall average extension length was 13.5 μm with a standard deviation of 0.5 μm. The PMMA nanofluidic device was made via NIL using a hybrid stamp (micro- and nanostructures). The nanochannel possessed dimensions of 250 × 250 nm. Reproduced with permission from Thamdrup et al. (2008).159

