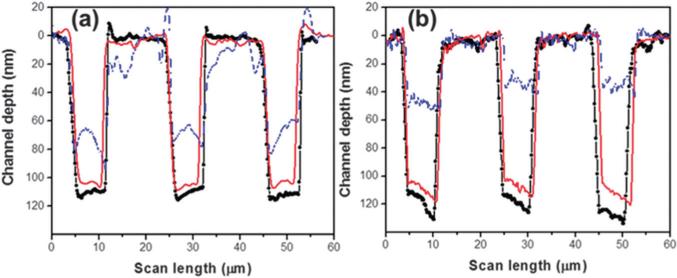
Fig. 8.
AFM profiles measured for (a) PMMA and (b) COC nanoslits (7 μm wide, ~100 nm deep, 12 μm pitch) before and after different cover plate assembly protocols. The blue-dash line represents the slit depth following thermal fusion bonding at 107 °C for PMMA and at 130 °C for COC slits; red-solid line is the depth of the slits following thermal fusion bonding at 87 °C and 115 °C of an oxygen plasma treated substrate and cover plate for PMMA and COC, respectively; and the black-circle line is the nanoslits following molding, but not subjected to thermal fusion bonding. Reprinted with permission from Chantiwas et al. (2010).59

