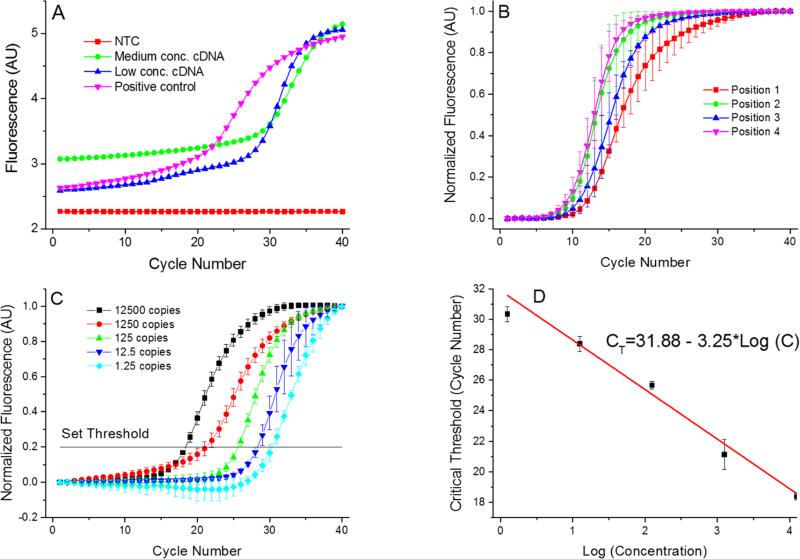
Figure 5.
(A) Single PCR run as it appears at the PCR display. These PCR amplification curves showing results from the 4 positions of the PCR device. We used complementary DNA (cDNA) from H7N9 HA gene for testing purpose. The AU stands for arbitrary units. Once the PCR completed, the MCAs were performed with a melting temperature value of (83.36 ± 0.63) °C (mean ± standard deviation). Measurement uncertainties emanate from the manual placement of the droplet. Slight droplet misalignments at the heater cause temperature variations between various experimental runs, thereby affecting the overall PCR efficiency. Also, due to these temperature variations, we readily observe a slight shift in the measured melting temperature. (B) Measurements performed at the 4 positions with identical concentration of all samples performed three times to suppress random error. The corresponding extracted critical thresholds (CT) are shown in Table 2. Greater value of CT at position 4 suggests lower amplification efficiency at that position. This may be caused by a temperature variation due to a non-optimized bonding process of the silicon chip to the PCB. (C) PCR results from position 1 with calculated number of cDNA copies in the sample from ≈ 12500 down to ≈ 1.25. These numbers are calculated by a 10× dilution starting from ≈ 12500. Since only whole number of cDNA copies per sample exist, fractional values imply the statistically most probably value. Each experiment was performed three times. (D) Extracted standard real-time PCR curve from results in Figure 5C showing CT value as function of LOG (cDNA concentration). The slope of (−3.02 ± 0.16) cycles at threshold per decade (mean ± standard deviation) corresponds to PCR efficiency of (0.91 ± 0.05) per cycle (mean ± standard deviation).

