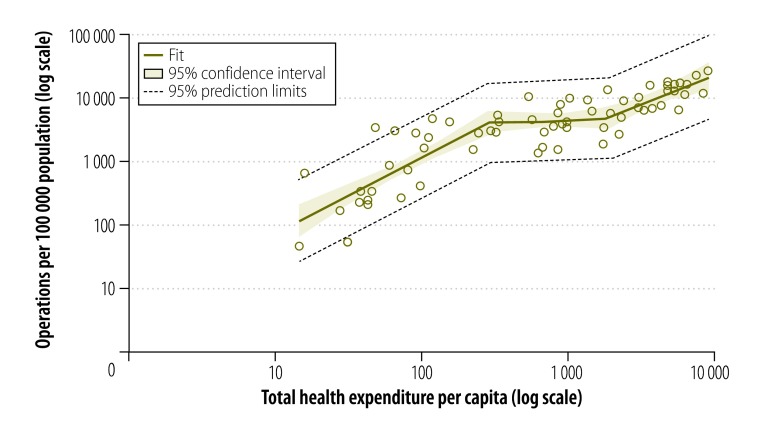
Fig. 1.
Relationship between observed operations and total health expenditure per capita, 66 Member States of the World Health Organization, 2012
Notes: Total health expenditure adjusted to United States dollars (US$) for the year 2012. Correlation between observed operations and total health expenditure per capita was r = 0.87297 (P < 0.0001). The adjusted cross validation was r2 = 0.7449. Inflexion points correspond with adjusted total health expenditure per capita; the first inflexion point is US$ 288 and the second inflection point is US$ 1950.

