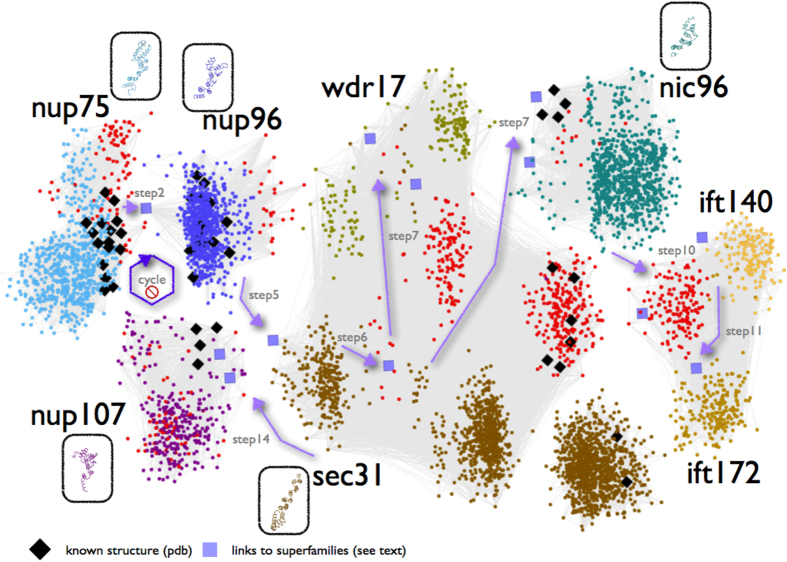
Figure 1. Pictorial representation of the sequence space walk connecting components of the nuclear pore complex, COPII and intraflagellar transport.
Members of each of the eight superfamilies are shown in distinct colors, with superfamily representatives of known structure enclosed in oval boxes following the same coloring scheme. Orientations of structural representatives are identical to the reference Nup75 structure (3F3F_C, Figure 2a). Two exceptions of the coloring scheme involve homologs of known structure (black diamonds-♦) and previously uncharacterized (unannotated) protein sequences (red dots-●). Intra-family connections detectable by pairwise sequence comparisons are represented by dense sub-networks of thin light-grey lines (see Methods). Inter-family connections revealed by iterative profile searches – otherwise undetectable, are depicted by (i) light purple arrows for the corresponding steps and (ii) squares for sequence links across superfamilies. Seven steps of the sequence space walk deemed as critical for revealing novel inter-family relationships are displayed (step 7 is shown twice, as it connects both to WDR17 and Nic96 superfamilies) – see also Table S2. The cycle with a ‘stop’ sign refers to the exclusion of Nup107 superfamily which terminates the search early (see Methods). Only a representative subset of hits is shown for clarity; this representation should only be taken as a rough sketch of the documented process (available as Data Supplement DS05). An annotated version of this two-dimensional layout is available as Data Supplement DS11.

