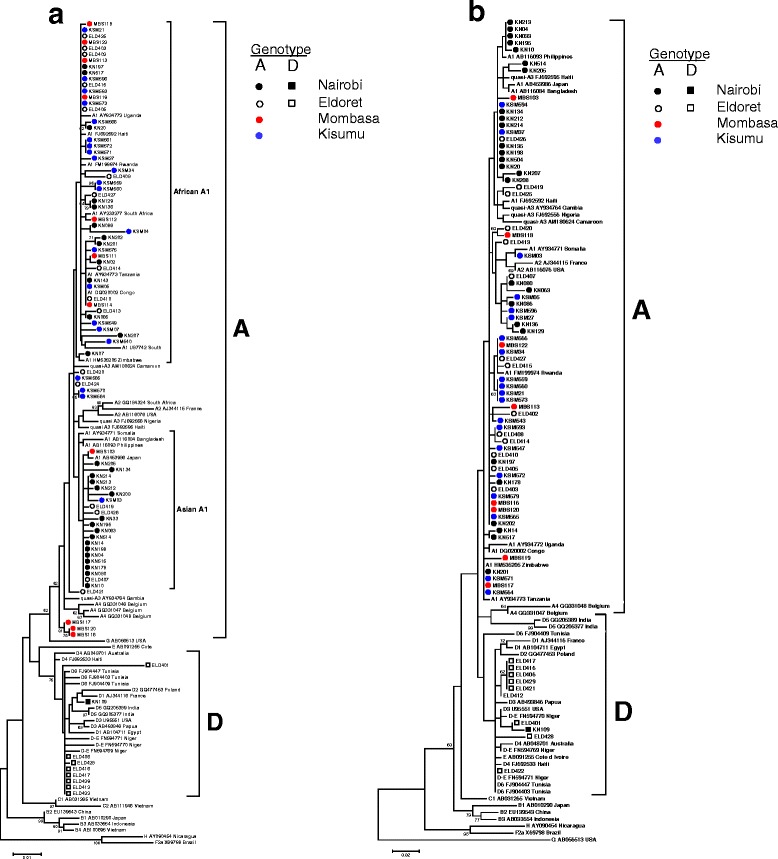
Fig. 2.

Phylogenetic analysis of Kenyan HBV subgenomic sequences. Specimen codes are described in the Results. Maximum likelihood analysis and neighbor-joining tree construction with 500 bootstrap replicates was performed by the K2 + γ model by MEGA v.5.2. Comparative GenBank sequences are designated by the subgenotype followed by the accession number and country of origin. Bootstrap confidence values ≥60 % are shown. a HBsAg (681 bp; nt 155 – 835) (b) BCP/PC region (307 bp; nt 1653–1959)
