Fig. 6.

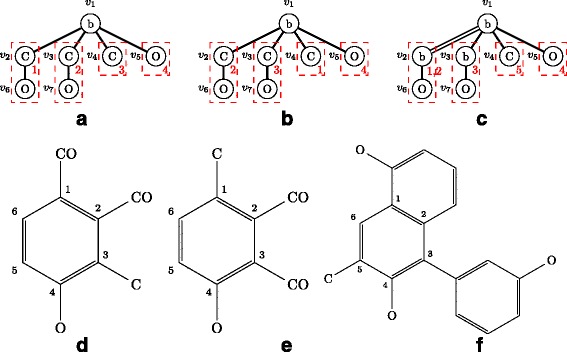
Examples of adjacent node lists and carbon position lists. a T 1. b T 2. c T 3. d Molecular graph of T 1. e Molecular graph of T 2. f Molecular graph of T 3. Red numbers represent carbon positions of node v 1

Examples of adjacent node lists and carbon position lists. a T 1. b T 2. c T 3. d Molecular graph of T 1. e Molecular graph of T 2. f Molecular graph of T 3. Red numbers represent carbon positions of node v 1