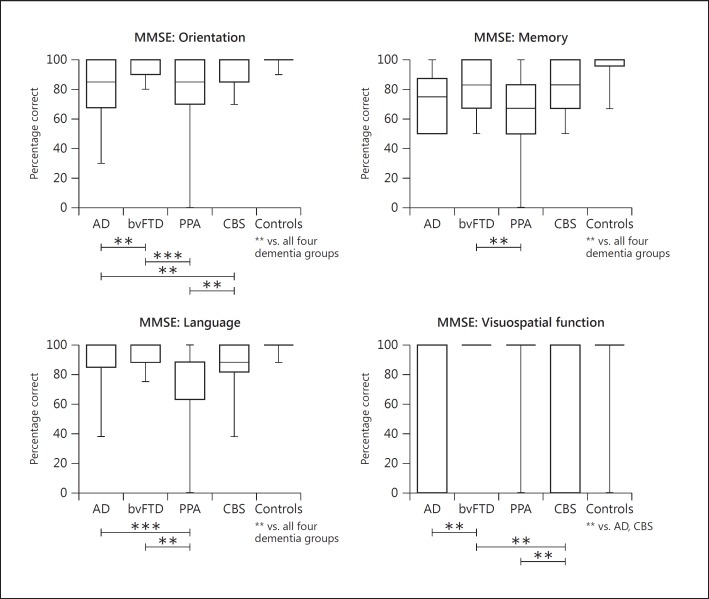
Fig. 3.
Performance on items of the MMSE of the patient groups and controls. Maximum and minimum values are displayed on the box-and-whiskers graphs. Significant differences between patient groups are indicated with capped lines. Graphs for the attention domain (serial 7s) were not included as non-significant group differences were obtained between dementia groups. Significant differences between patient groups and controls are indicated below the control group. ** p < 0.01; *** p < 0.001.

