
Figure 4. Contrast-enhanced ultrasound in an 11 week gestation human subject.
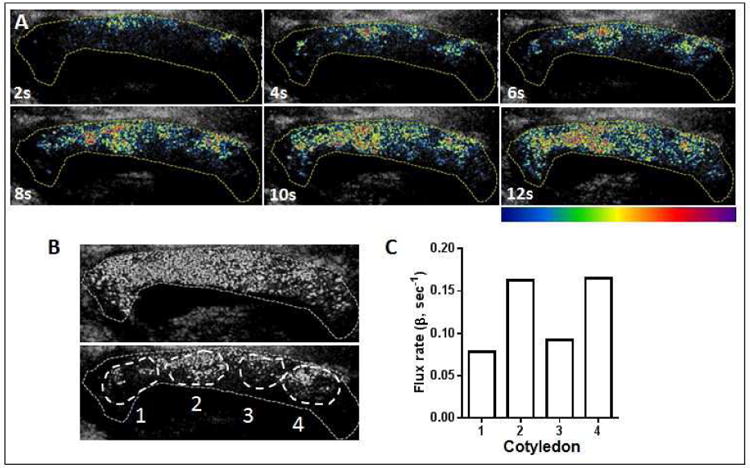
(A) Sequential frames taken at 2 second (s) intervals post ‘burst’. The yellow dotted line outlines the placenta and the earth map overlay aids visualization of placental perfusion in the late first trimester with a color scale bar indicated from low (blue) to high (red-purple) blood flow. (B) The white overlays represent four individual cotyledons within the 11 week placenta labeled 1 to 4, and (C) Flux rate in each of the four individual cotyledons demonstrating regional variance in perfusion kinetics within the placenta.