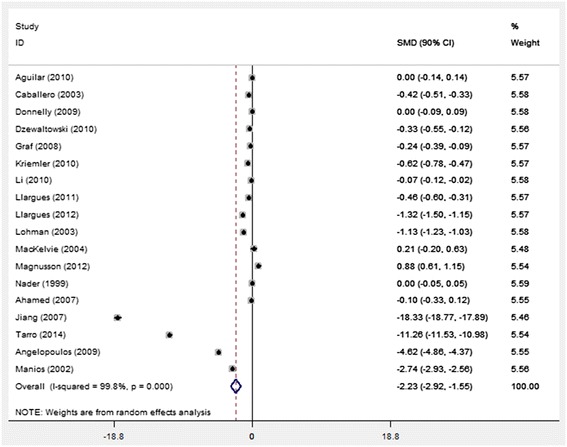
Fig. 2.

The forest plot for the 18 studies by publishing year. The filled triangles and diamonds represent the SMD and 90 % confidence interval for each study with a default weight percentage. The diamond with hollow refers to the overall SMD and 90 % CI, along with the vertical dashed line as centerline of the average SMD for the 18 studies. Random effect was used for the analysis
