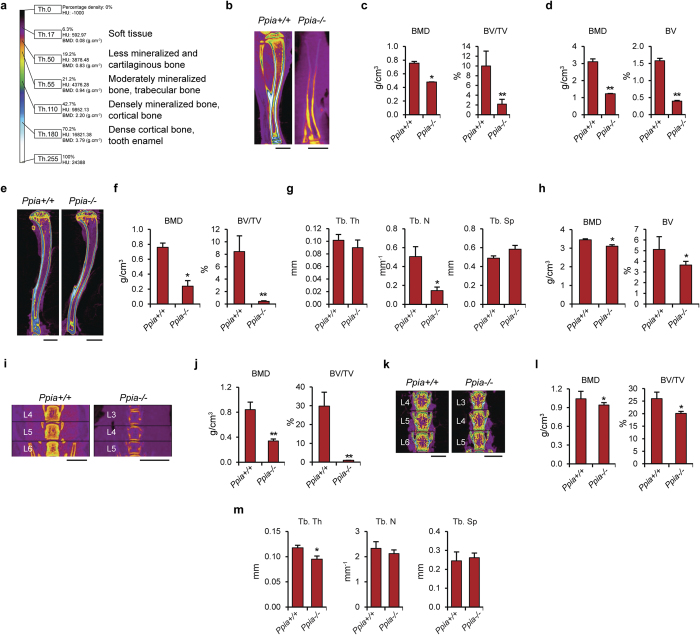
Figure 1. MicroCT analysis of Ppia+/+ and Ppia−/− mice.
(a) Color scale bar is shown to indicate threshold, HU and BMD values, and tissue types correspondent to select colors. (b) Mid-coronal cross sectional images of the tibia from three-week old Ppia+/+ and Ppia−/− mice. Image is color-coded based on tissue density level. Ppia−/− tibias showed an average of 26% reduction in length. Scale bars: 2 mm. (c) Quantification of trabecular BMD (bone mineral density) and percent bone volume (BV/TV) in the distal tibia. (d) Cortical BMD and BV (bone volume) in the tibial shaft. (e) Overview mid-coronal cross sectional images of the proximal tibia from 13-week old mice. The Ppia−/− tibias showed an average of 11% reduction in length. Scale bars, 2 mm. (f) Quantification of trabecular BMD and BV/TV in the proximal tibia. (g) Quantification of Tb. Th (trabecular bone thickness), Tb. N (trabecular number) and Tb. Sp (trabecular space) in the proximal tibia, 13 weeks. (h) Cortical BMD and BV in the tibial shaft. (i) Mid-coronal cross sectional images of the lumbar vertebrae from three-week old Ppia+/+ and Ppia−/− mice. Ppia−/− vertebral bodies (at the three terminal lumbar vertebrae analyzed) showed an average of 40% reduction in height with visible reduction in bone quality (volume, density, and structure) compared to WT. Scale bars: 1 mm. (j) BMD and BV/TV in the lumbar vertebrae. (k) Mid-coronal cross sectional images of the lumbar vertebrae from 13-week old Ppia+/+ and Ppia−/− mice. Ppia−/− vertebral bodies (at the three terminal lumbar vertebrae analyzed) showed an average of 13% reduction in height with visible reduction in bone quality (volume, density, and structure) compared to WT. Scale bars: 1 mm. (l) BMD and BV/TV in the lumbar vertebrae. (m) Quantification of Tb. Th, Tb. N and Tb. Sp in the lumbar vertebrae. n = 6 for WT group at 3 and 13 weeks old. n = 5 for KO group at 3 weeks old. n = 4 for KO group at 13 weeks old. *P < 0.05, **P < 0.01 compared to Ppia+/+. Data represented as mean and SEM.

