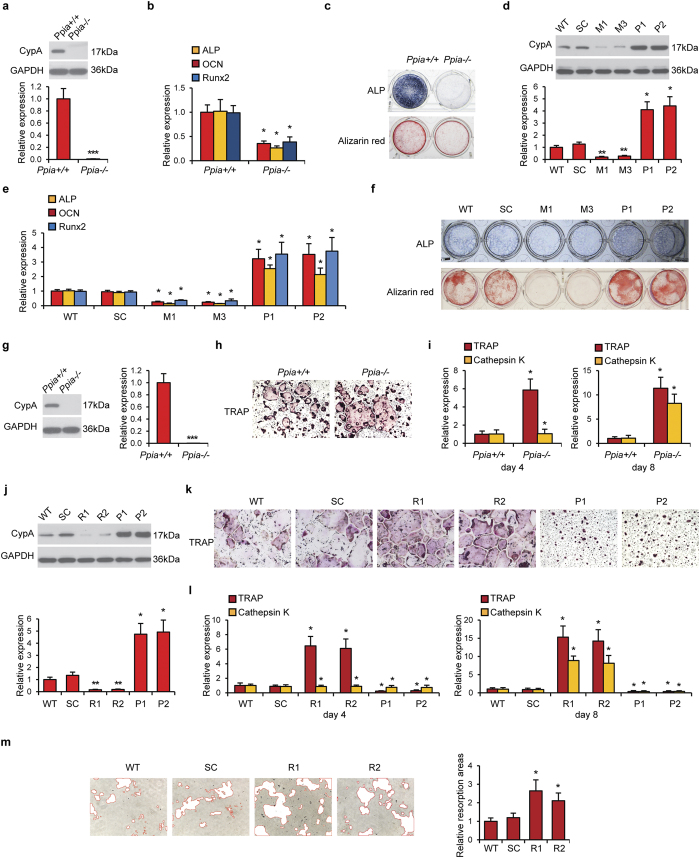
Figure 3. Differentiation of osteoblasts and osteoclasts with CypA dysregulation.
(a) Western blot of CypA in Ppia+/+ and Ppia−/− primary osteoblastic cells. GAPDH was used as a loading control. (b) ALP, OCN and Runx2 expression in Ppia+/+ and Ppia−/− osteoblastic cells after seven days of osteogenic differentiation. (c) ALP and Alizarin red staining in Ppia+/+ and Ppia−/− osteoblastic cells after seven and 21 days of osteogenic differentiation, respectively. (d) CypA levels assayed in MC3T3-E1 osteoblastic cells after silencing or forced overexpression. Two clones for CypA silencing are referred to as M1 and M3, while two clones for overexpression are designated P1 and P2 (comparison include scrambled control, SC, and wildtype parental cells, WT). (e) ALP, OCN and Runx2 expression in WT, SC, M1, M3, P1 and P2 MC3T3-E1 cells after seven days of osteogenic differentiation. (f) ALP and Alizarin red staining in WT, SC, M1, M3, P1 and P2 MC3T3-E1 cells during osteogenic differentiation. (g) Expression of CypA in Ppia+/+ and Ppia−/− mouse primary osteoclastic cells. (h) TRAP staining of Ppia+/+ and Ppia−/− osteoclast cells after seven days of osteoclastic induction. (i) TRAP and Cathepsin K expression in Ppia+/+ and Ppia−/− osteoclastic cells after four and eight days osteoclastic induction. Magnification: 10 ×. (j) CypA levels assayed in RAW264.7 osteoclastic cells after silencing or forced overexpression. Two clones for CypA silencing are referred to as R1 and R2, while two clones for overexpression are designated P1 and P2 (comparison include scrambled control, SC, and wildtype parental cells, WT). (k) TRAP staining in (j). Magnification: 10×. (l) TRAP and Cathepsin K expression in WT, SC, R1, R2, P1 and P2 RAW264.7 osteoclastic cells after four and eight days osteoclastic induction. Data represented as mean and SD of three experiments of each group. (m) Resorptive activity assay in WT, SC, R1 and R2 RAW264.7 cells after seven days of osteoclastic induction. Resorptive areas are highlighted in red at 10× magnification. *P < 0.05 compared to Ppia+/+ or WT cells.

