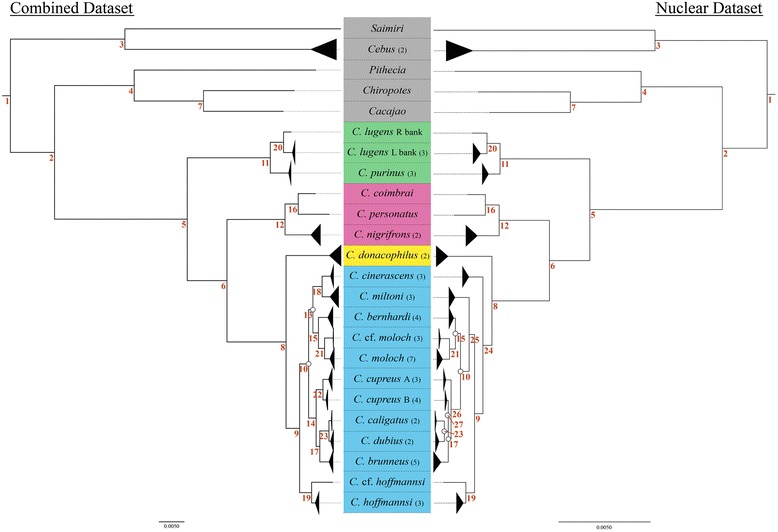
Fig. 2.

Molecular phylogeny showing relationships among Callicebus taxa based on 53 Callicebus and 6 outgroup individuals. Shown are maximum likelihood trees inferred from the combined dataset (left) and the nuclear dataset (right), with branches collapsed to represent clades of interest. Numbers in parenthesis indicate the number of individuals represented in the collapsed clade. See Additional file 2 and 3 for the expanded ML (RAxML) and Bayesian (MrBayes, BEAST) trees with node support values. Unmarked nodes were significantly supported in all analyses (BP ≥ 70 % and PP ≥ 0.95), while nodes marked with white circles received low support (BP < 70 % and/or PP < 0.95). Red numbers represent nodes of interest listed with support values for all methods of analysis in Additional file 1. Background colours reflect species group; green for the torquatus group, pink for the personatus group, yellow for donacophilus group, blue for the moloch group; and grey indicates the outgroup species
